
Key Insights:
- Hedera (HBAR) has formed a bullish price action pattern and is poised for a breakout.
- HBAR price could soar by 25% if it closes a daily candle above the $0.192 mark.
- Traders are over-leveraged at $0.1848 on the downside and $0.1924 on the upside.
HBAR price is set to break its recent downward trend. This move could reverse the sluggish sentiment that has persisted for over a week.
Hedera on the four-hour chart reflects a similar trend to the recently broken descending channel seen daily. This pattern suggests a potential reversal, aligning with previous market movements.
With current market sentiment, experts and crypto enthusiasts are watching closely. They are eager to see whether a similar upside movement unfolds in the coming days.
HBAR Price Action & Technical Analysis
Expert technical analysis indicates that the HBAR price has developed a descending channel pattern over four hours. The price is approaching a potential breakout, which could signal a shift in market momentum.
However, on the lower time frame, HBAR appears to be struggling near the channel’s upper boundary. It has historically seen selling pressure and price declines.

If HBAR price successfully breaks out and closes a daily candle above $0.192, it could signal a strong bullish trend. This breakout may pave the way for a 40% rally, pushing the price toward $0.266 in the coming sessions.
On the other hand, if it fails to break out of the channel pattern, HBAR price could decline by 5%. Beyond its price movement, HBAR is visibly retesting its descending trendline on the higher time frame.
Additionally, the price is breaking out of a bullish cup-and-handle pattern, signaling potential upside momentum. This pattern will remain valid only if HBAR holds above the $0.174 mark; otherwise, the pattern will fail.
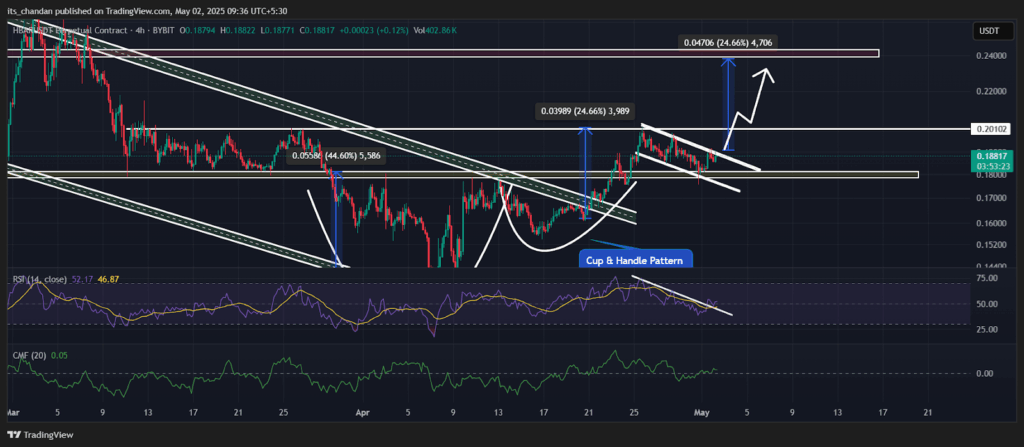
HBAR’s Relative Strength Index (RSI) stands at 56 at press time, indicating that market sentiment is balanced. It also suggests that the asset is neither in overbought nor oversold territory.
According to experts, in such a condition, a breakout or breakdown could determine the upcoming trend, whether bullish or bearish. However, another technical indicator, the Chaikin Money Flow (CMF), signals intense buying pressure in HBAR.
Currently, the CMF value stands at 0.07, while the HBAR price is near a breakout. This suggested an upward move that could propel the asset in the coming days.
Bullish On-Chain Metrics
With HBAR price approaching the upper boundary of the descending channel pattern, market opinions are divided. According to Coinglass, investors and traders hold conflicting perspectives on its next potential move.
Exchanges have recorded an inflow of $1.12 million worth of HBAR tokens in the past 24 hours, according to spot inflow/outflow data. This substantial movement suggests increased trading activity, potentially signaling shifting market sentiment.
The large inflow of tokens from wallets to exchanges suggests a possible selloff. This shift could create selling pressure, potentially driving prices lower.
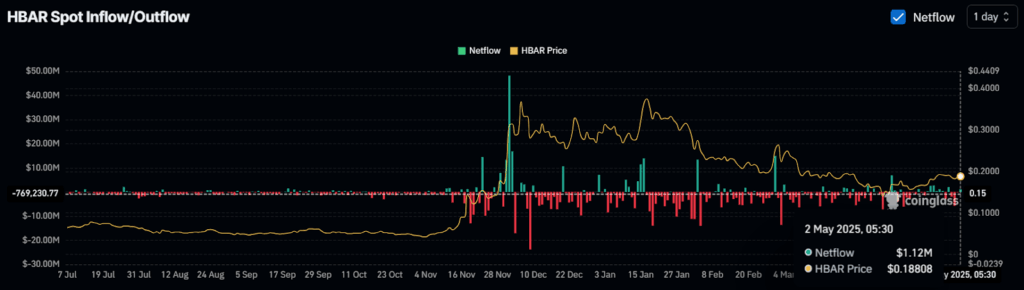
Whenever HBAR price hits the upper boundary of the channel pattern, exchanges typically record an influx of tokens. This trend is often followed by a price decline, suggesting increased sell pressure at key resistance levels.
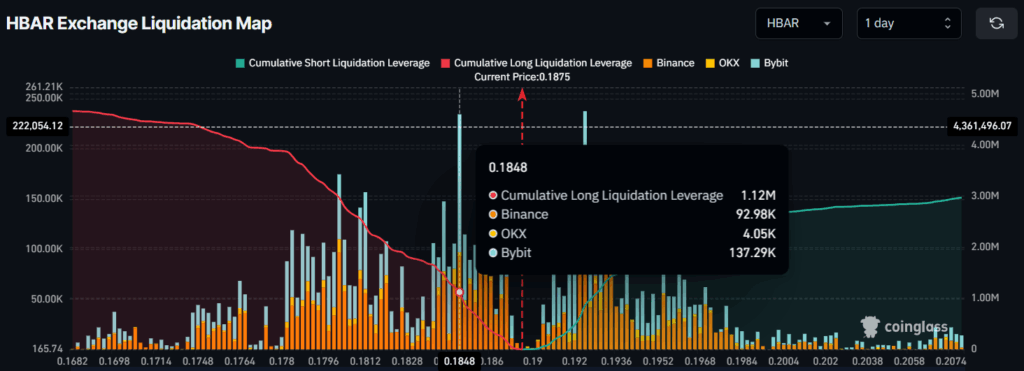
On the other hand, traders appear to be bullish, as they are strongly betting on the bullish side. On-chain metrics indicate that traders are over-leveraged at $0.1848 on the support side and $0.1924 on the resistance side.
This positioning suggests heightened volatility, as leverage levels could amplify price movements in either direction. Over the past 24 hours, traders have opened $1.12 million in long positions and $860K in short positions at these levels.
This positioning suggests a bullish sentiment toward HBAR, as long positions outweigh shorts in market activity.
On-chain metrics and technical analysis show a balanced market with no clear dominance from bulls or bears. The price is approaching a breakout, which could soon shift momentum in either direction.