

Key Insights:
- In an attempt to recover TRUMP’s loss, a whale opened a 10x long on PEPE, but the bad luck continued—sitting on a mounting unrealized loss.
- After a CHOCH breakout, PEPE price hit resistance near $0.00001500.
- Dense liquidation clusters could be seen on the Binance PEPE map close to the price of $0.00001362.
Pepe (PEPE) news whale activity, price prediction and liquidation map suggested the meme coin could continue with its upward trend.
PEPE News on Whale Activity
After TRUMP’s partial liquidation, a massive trader pledged $16.17M to a 10x leveraged long in PEPE with a small unrealized loss relative to the position. The whale kept 122.27B kPEPE but was now on the hook for a $57.18K.
Above this liquidation threshold of $0.011957 the high-leverage bet became very pressured. Any retrenchment into or around some liquidation pointed it could trigger mass liquidations and increase momentary price volatilities.
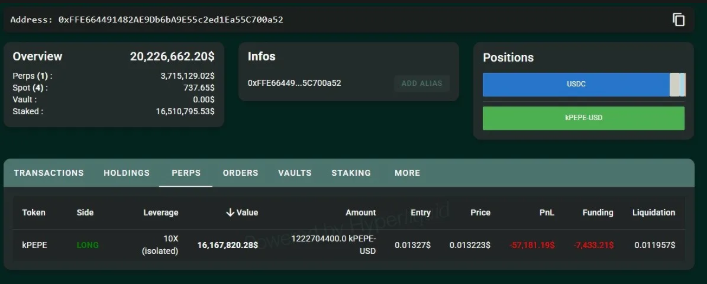
If on the other hand, PEPE continues to be above the entry price, there was a possibility of reigniting the interest of buyers.
TRUMP’s seizure in sales caused concern, but the outcome of PEPE’s journey is, after all, determined by which side of the market took up the upper hand in this vicinity.
PEPE Price Prediction
Since PEPE’s price stalled at $0.00001500, where it made a temporary high, the meme coin dropped by 3.21% to end up at $0.00001324.
A decisive breakout from Price Structure after a Change of Character (CHoCH) was later validated by a Break of Structure (BOS), being a return to a bullish trend after extended consolidation.
The BOS above $ 0.00001000 was bullish transition and the following move attained the $0.00001400 level. However, the latest pullback close to $0.00001300 revealed that PEPE may turn into consolidation or minor retracement.
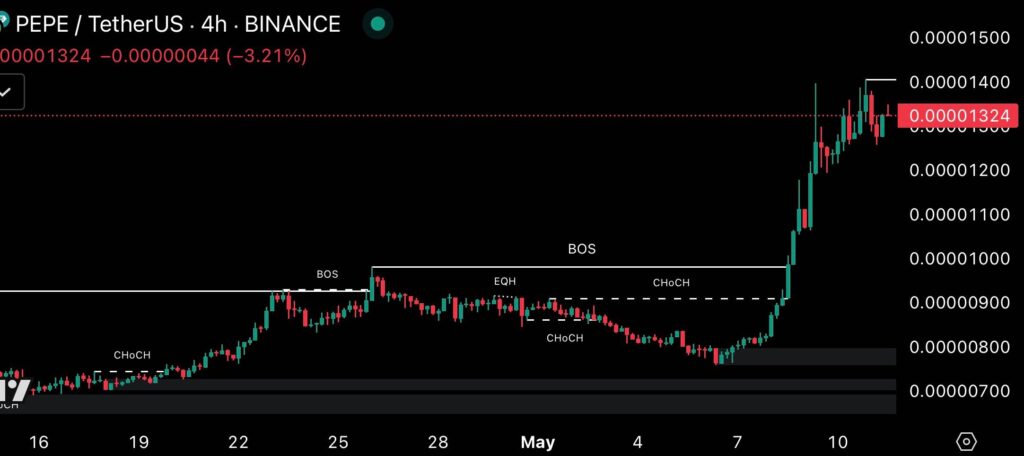
For PEPE to maintain bullish, it needed to break and trade above $0.00001500 on close. A breakout above this level may well pave the way for an ascent to $0.00001700 or higher, and more of the bullish trend.
The failure to protect $0.00001324 might support the price moving back to the preceding breakout support zone at If the price drops below this point.
This may destroy the bullish structure and provoke a rebound to the old demand areas at $0.00000800 and $0.00000700.
On the aggregate level, the performance of PEPE will be determined by success in maintaining support above critical breakout points.
PEPE News: Liquidation Map
Dense liquidation clusters were seen on the Binance PEPE map close to the press time price of $0.00001362. Elderly than $0.00001380, the overall quantity of short liquidations accumulated almost $15M in leverage positions.
If PEPE’s price were to destroy this range, the probability of short liquidations would boost the momentum and price towards the $0.00001500 zone.
Downward risk could be found while the long liquidations were intensely bundled in the price range between $0.00001280 and $0.00001320. This would result in a further drop if buyers did not take charge.
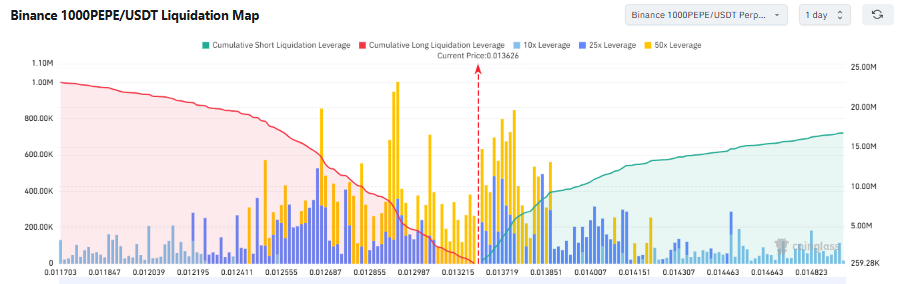
The $0.00001300 mark was populated with significant 10x, 25x, and 50x leverage, especially dense concentration in this region.
If it breaks, this support base could see a rush of liquidations, the price swiftly plummeting to $0.00001220 and $0.0000118.
The yellow and blue bars posit high leverage and with 25x and 50x longs getting even more fragile as they close in on today’s pricing.
On aggregate, this is itself a turning point for PEPE. A decisive break through either above or below $0.00001362 may see tremendous price swings courtesy of the close proximity of tight liquidity barriers, which may feed the move.