

Highlights:
- Kaspa’s bubble risk hits 1.3 as resistance zone approaches.
- Trading volume jumps 61%, indicating growing market participation.
- Momentum remains strong while volatility risk continues to increase.
CoinMerge and CoinMarketCap’s data insights point to rising short-term risks for Kaspa (KAS), the fast-rising Layer-1 blockchain. KAS is at $0.1235 today, down 5.77% over the last day, however its on-chain data and technical readings suggest it is at a resistant area, with high volatility possible.
According to the data, Kaspa’s short-term bubble risk indicator has hit 1.3, indicating things are starting to heat up. The measurement, which tracks price against 20-week trends, now suggests KAS is in the yellow-green warning area after spending a long time under 1.0.
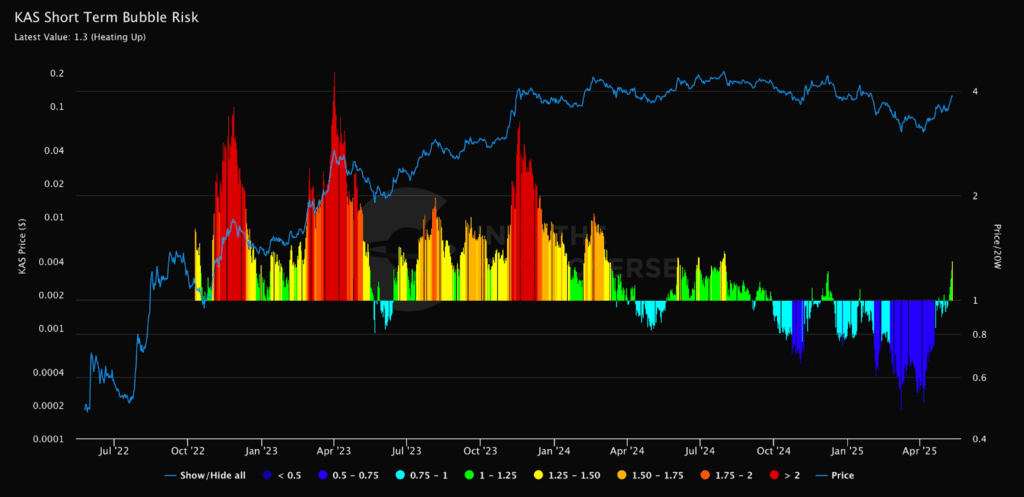
The period from mid-2024 to the beginning of 2025 saw the indicator stay mainly under 0.75, matching stretches of price stability and little upside movement. The recent rise in price has sent the metric rising, getting close to historically red zones related to short-term peaks.
Although we are not yet in the danger area above 1.75, the quick rise in price and bubble risk clearly indicates a new direction.
The graph shows that Kaspa’s earlier bubble periods, as shown in orange and red, have frequently been followed by major price declines. This latest rise means that price has moved far from its usual trend in recent weeks, making volatility more likely.
Breakout Attempts Amid Key Resistance
On the charts, Kaspa is facing an historical resistance cluster between $0.107 and $0.13. TradingView data showed a KAS bounce to $0.126, hitting the upper resistance line and being turned away.
A projected bullish outline on the chart shows Kaspa could rise to $0.305, which is the 1.618 Fibonacci extension. KAS will have to break out clearly above $0.135 and then secure a position above $0.205, the next significant resistance identified.
The projection displays a possible multi-phase climb, but Kaspa must overcome resistance strongly and with support.

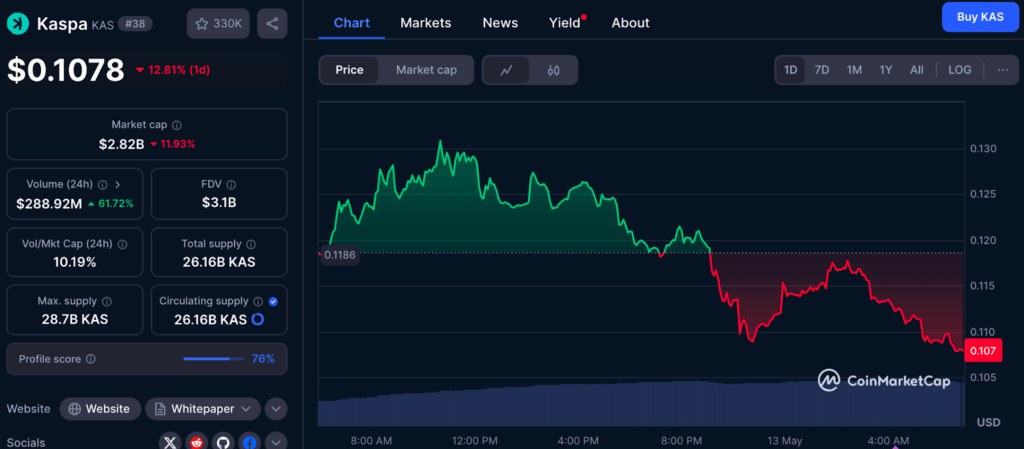
According to recent market data, Kaspa has attracted a lot more traders. The trading volume inside the last 24 hours grew by 61.7% to $288.9 million, indicating there are more traders involved and liquidity has improved. The current fully diluted valuation of $3.1 Billion and 26.16 Billion circulating KAS coins put the project at a 38th rank by market cap.
KAS is changing hands actively, as its 10.19% volume-to-market cap ratio points out. Still, the over 12% decline in price in recent days suggests traders are selling at resistance levels despite the rise in volume.
Kaspa Price Charts Show an Uptrend Channel Maintained, Momentum Strong
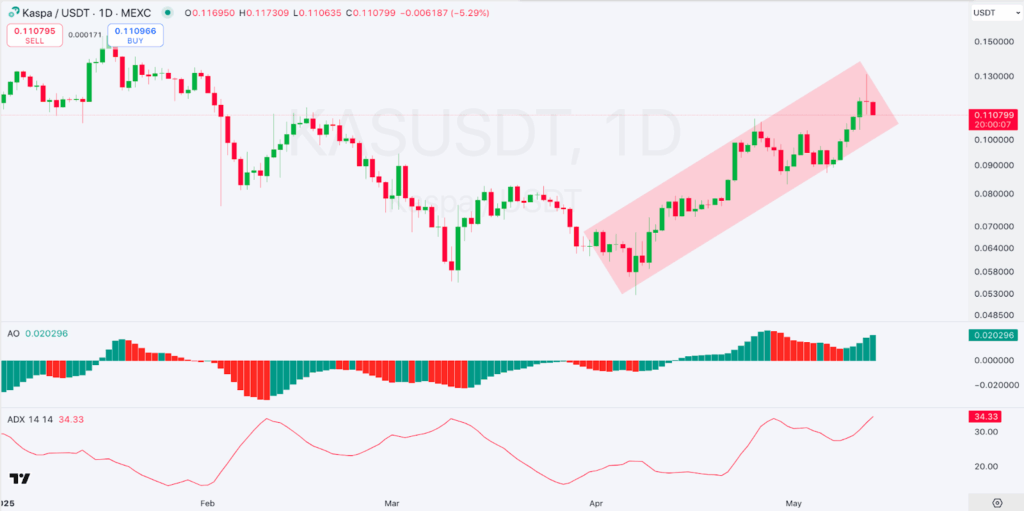
On the daily chart at MEXC, KAS/USDT is following a bullish channel even after the recent dip. The crypto asset holds $0.107, staying in the uptrend that formed at the start of April.
The Awesome Oscillator is still above zero at 0.0203, showing buyers have the upper hand right now, although recent bars on the histogram are falling. When writing, the Average Directional Index (ADX) was 34.33, confirming a strong trend. As a result, we can expect increased volatility along with attempts to break out over the next few days.
As long as KAS stays above $0.095 on the daily chart, the channel indicates the bulls are in charge. A break above $0.13 accompanied by rising volume could push the price up to $0.205.
KuCoin’s 3D chart volume profile makes it clear that $0.08 to $0.115 is an area where a lot of trading activity has taken place. Many traders have likely bought KAS in this range, which is the reason it’s so hotly contested by bulls and bears.
Once KAS takes out $0.135, the price could test the upper profile node around $0.205. If KAS moves past those levels, the 1.618 Fibonacci extension demands the $0.305 level as a key online at nearly 200% above the current price.
Support for the price near $0.082 is shown in the market’s profile, making it a key level to stop any further downside.