

Key Insights:
- BRETT breaks out of the falling wedge, targeting $0.085 to $0.091 next.
- Long-term charts hint at 100x potential if momentum holds above $0.10.
- Strong volume confirms breakout, aligning with multi-timeframe signals.
Brett coin is gaining attention as multiple bullish technical patterns align, suggesting the potential for a major breakout. Analysts are pointing to key support levels, breakout confirmations, and long-term projections that indicate a substantial upside for the token.
With increasing momentum and growing trader interest, BRETT price could be setting the stage for an explosive rally.
Brett Coin Falling Wedge Pattern Signals Reversal
CRYPTOMOJOTA highlighted that Brett coin has recently seen a breakout from a falling wedge, often considered a sign that a downtrend is coming to an end. The analyst mentioned that the token had managed to bounce back from critical support zones, suggesting it might see a rise soon.
If prices formed a tightening wedge pattern with lower highs and lower lows, this can predict a significant price uptrend. As the price nears the apex of the wedge, sellers become weaker and allow for a strong move to the upside.
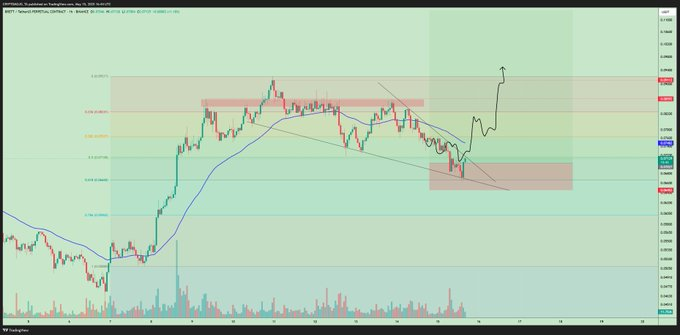
As CRYPTOMOJOTA pointed out, the current price targets for Brett coin are $0.085 to $0.091, with those levels matching areas where selling has taken place. When these levels are beaten, the price may accelerate up further to $0.10 and even higher.
Breakout Confirmed on Shorter Timeframes
According to NihilusBTC, a breakout in the 30-minute BRETT chart supported the trend toward higher prices. A rise above a trendline, together with higher trading activity, suggests that buyers are now in charge of the market. Historically, this sign of a short-term rally is followed by much bigger and longer-lasting gains.
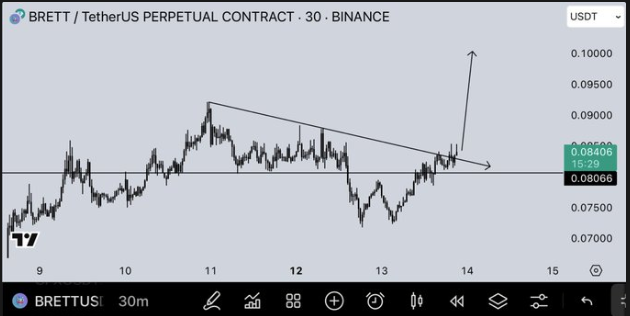
At $0.090, a key resistance level has been holding back further increases in the past several sessions. If this level gets cleared, it could set the stage for the price to move up toward the $0.10 to $0.12 range.
Long-Term 100x Potential Highlights Major Upside
Steph_is Crypto believed Brett coin could deliver a 100x return over time. From the analyst’s weekly chart, it is obvious that Brett price just broke out of a strong wedge pattern, considered a bullish indicator.
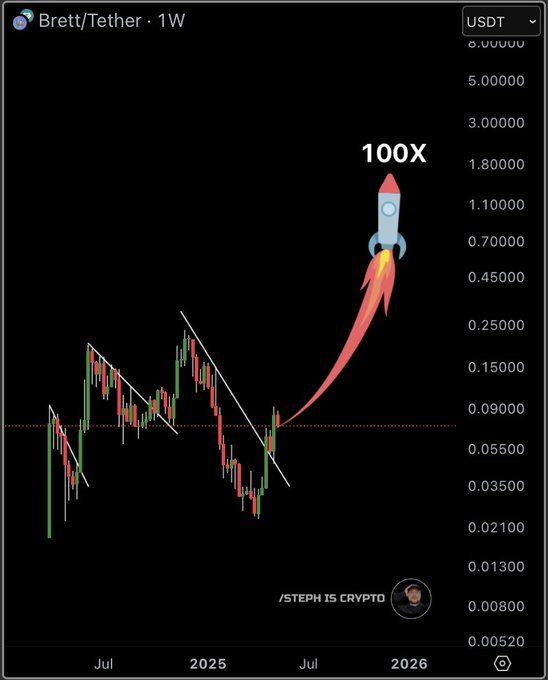
The prices on this chart suggest that BRETT might climb as high as $1.00 or more if things continue the way they are now. This scenario is possible because the token could be breaking away from a drawn-out downtrend that comes before an upside move.
At the same time, data from Coinglass revealed that traders are becoming more optimistic about BRETT. Many investors are turning positive, and futures trading showed more buyers than sellers. With multiple technical breakouts and positive signs, the rally may continue.
However, if the support does not hold between $0.068 and $0.070, a further decrease in price is possible. Because altcoins typically have high volatility, it is important to practice risk management when trading them.
Outlook: Key Levels to Watch for BRETT’s Next Move
Notably, a rally seems possible for Brett coin as it sees multiple bullish signals. Resistance can be expected around $0.091, and then at the significant $0.10 level. If these hurdles are cleared, Bitcoin could see a further move from the current $0.15 to $0.25 price range based on predictions.
But if support levels are broken, the markets might reverse course very quickly. So far, running technical and hiking volume have led to a bullish bias, but the next move upward will be vital.
At the time of writing, Brett coin is currently valued at $0.07235 and sees a daily rise of 4%. The current market cap of the token is $717.03M, and a 24-hour trading volume stands at $45.58M, growing by 18.85%. As of writing, there were 9.91B BRETT in circulation, out of the total 10B supply.