

Key Insights :
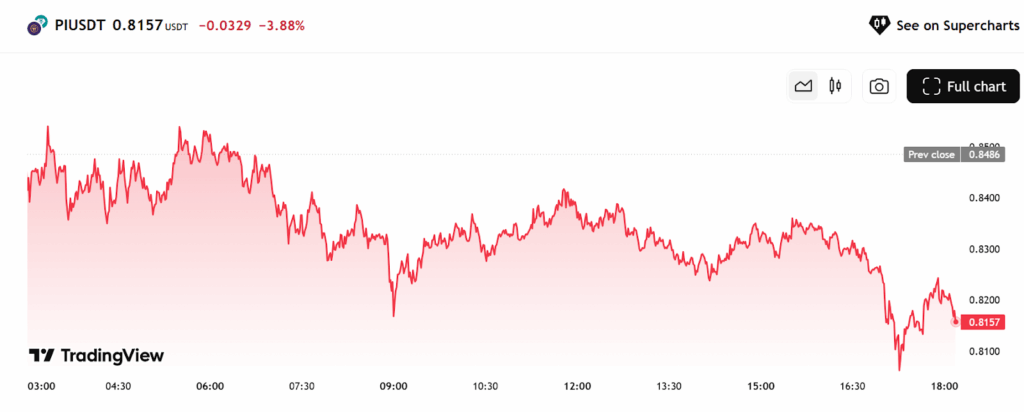
- Pi Coin holds strong above $0.8100 support despite a 3.88% daily drop, signaling buyer interest.
- Daily trading volume remains steady at nearly $300M, showing consistent market activity.
- RSI approaches 50 on the daily chart, hinting at a possible bullish reversal ahead.
Pi Coin price has recently attracted attention as traders observe a potential breakout point. The digital asset is hovering around a key support level. If it holds, there is speculation that it could rise to $3.5.
Recent trading patterns show increased volume and market activity, suggesting upcoming volatility. If buying interest grows near this support, a move upward could be likely over the coming weeks.
Current Price Behavior and Market Sentiment
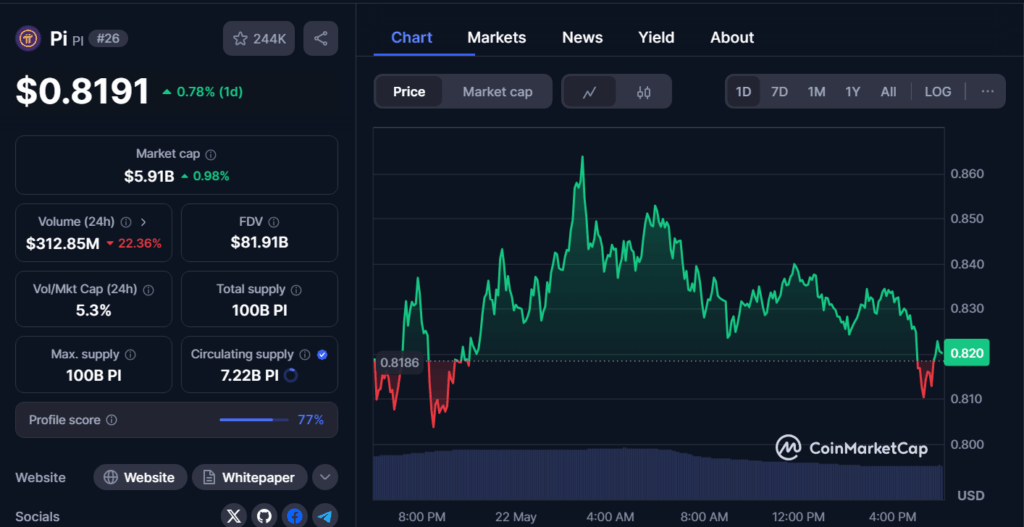
At press time, Pi Coin price was trading at $0.8191, showing a 0.78% increase over the last 24 hours. The recent trading range remains between $0.68 and $0.86, reflecting a state of consolidation after a previous downtrend.
The coin has shown signs of resilience as buyers re-enter near the lower support levels. Market participants appear cautious but engaged.
Trading volume over the last 24 hours reached $312.85 million, even though it declined by 22.36%. This suggests short-term traders may be stepping back while longer-term holders watch for more decisive price action.
Technical indicators show that the short-term moving average is trying to level out, which may signal a bottoming formation. However, the mid-term and long-term moving averages are still sloping downward, confirming that the bearish trend remains in place.
Support Levels and Technical Patterns
The key support zone lies between $0.78 and $0.81, where the price has repeatedly rebounded. This area attracts buyers, possibly due to perceived undervaluation or strategic accumulation. If Pi Coin price maintains this support, it could provide the foundation for an upward price move.
Price activity has formed a consolidation pattern just above this support range. This tight price movement indicates that neither buyers nor sellers have taken control. A breakout from this range could lead to a new trend direction.
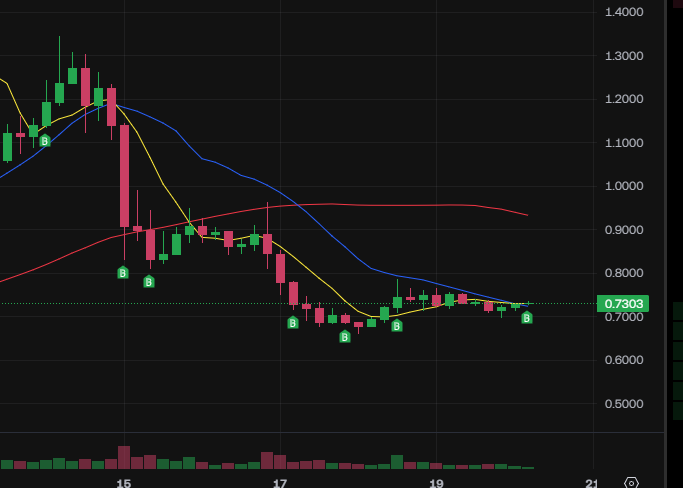
Repeated “B” signals on the chart suggest consistent buying interest at these lower levels. These could come from short-term traders or long-term investors accumulating in expectation of a rally. Pi must break above the mid-term moving average with increased volume to gain strength.
Market Metrics Show Moderate Liquidity on the Pi Network Price
Pi Coin’s market capitalization is $5.91 billion, which has increased by nearly 1% in the past day. This value increase supports growing investor interest despite lower trading activity.
The fully diluted valuation (FDV) stands at $81.91 billion, reflecting future potential if the full supply enters circulation. With a circulating supply of 7.22 billion Pi out of 100 billion, most tokens are still locked.
This controlled release may reduce inflationary pressure and support future price growth. Investors often monitor the supply release to anticipate market shifts.
The volume-to-market cap ratio currently sits at 5.3%, showing moderate liquidity. This level allows for active trading without severe slippage, which is vital for retail and institutional traders.
Sustained liquidity at this level may help Pi maintain current support and prepare for potential upward movement.
Future Outlook and Key Levels to Watch for the Pi Coin Price
Pi Coin price must break above $1.20 to move towards $3.5 USDT. This can happen only when buyer demand grows, and the market and the rest of the crypto industry improve.
It would catch more attention if Pi Coin could surge past $0.80 and exceed its mid-term moving average. A rise in volume and a new high mark is a strong move and could mean the market can move higher. A break of $0.78 could still result in the price moving lower.
All traders should monitor price action around the present support zone. An opening above this zone might lead more people to notice Pi Coin and support its recovery.
While we haven’t seen a clear breakout, the coin is neutral to bearish. However, this could change very rapidly if something significant happens.