

Key Insights :
- Solana price prediction: SOL must break $208 to validate wave-iii and trigger targets at $250–$290.
- CoinGlass data revealed that 50.9% of traders in the Solana market have a buy position, reflecting strong optimism.
- Ali Martinez’s pattern, the cup and handle, points to a parabolic increase that could push the price above $208.
Solana price is now close to a pivotal technical area, signaling that bulls are gaining ground. Prices staying above $180 suggest stability in the market.
A move beyond $208 might indicate the start of wave III. SOL price could rise between $250 and $290 if this wave gains momentum. Chart patterns and options data are backing up this setup.
Solana Price Prediction Must Break $208 to Confirm $250 Targets
Analyst Man of Bitcoin highlighted that the Solana price is back in the ideal resistance zone. The key level to watch remains $208. If SOL price moves above this key Fibonacci level, it signals the start of wave-III in the Elliott Wave cycle.
This phase is often the most powerful, driving a strong upward trend. Upon validation of this pattern, the SOL price short-term goals could be $250 and $290 in the coming weeks.
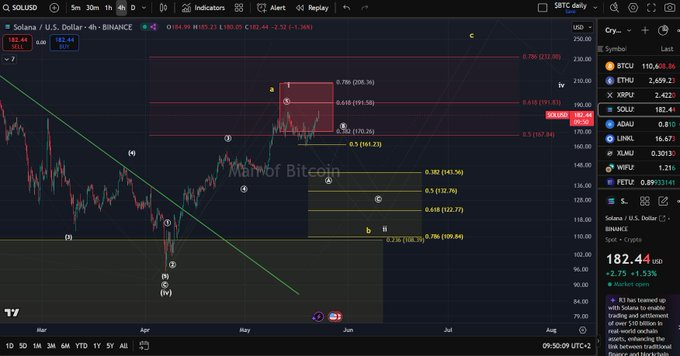
On the 4-hour chart, Solana price consolidates after forming higher highs and higher lows, confirming an uptrend structure. The market is still gaining momentum, and prices are approaching an area that might signal a bullish breakout.
If the price is rejected at $208, it may drop toward the $172–$170 range. However, a bullish trend will likely follow if the breakout continues.
Solana Price Builds Bullish Momentum Above $180 Structure
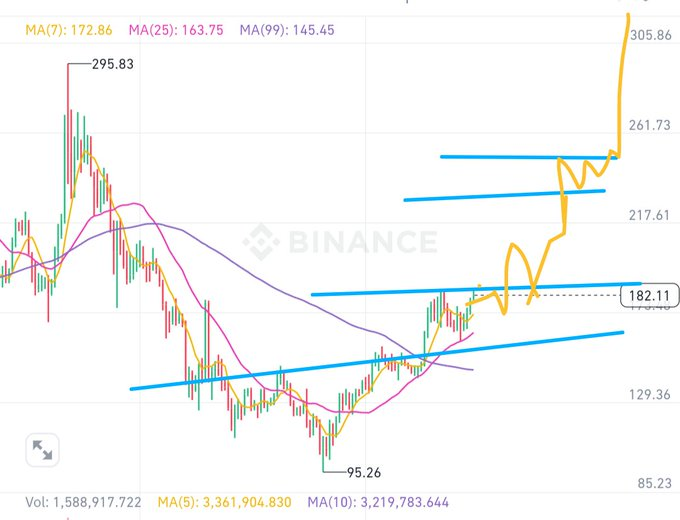
Technical patterns showed that SOL has reclaimed the 7-day, 25-day, and 99-day moving averages. Solana was only $100 off its all-time high at press time, indicating strong bullish momentum.
The price is forming an ascending channel, signaling potential for further gains. Analysts believe Bitcoin’s liquidity shifting to altcoins could push SOL to the $250–$290 range. If this happens, Solana price may regain its previous 2021 trading levels.
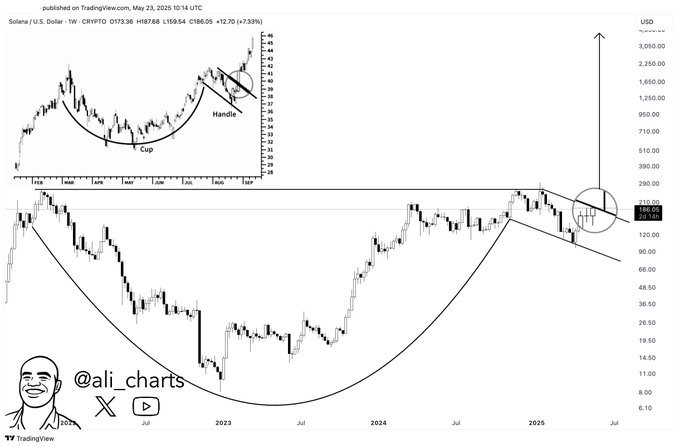
Some analysts confirmed that a long-term cup and handle pattern supports this bullish setup. Based on the weekly chart pattern, if the top altcoin clears horizontal resistance, it might make a parabolic move.
The pattern is similar to previous setups before strong rallies. The price is gradually moving toward the primary resistance level.
SOL Long/Short Ratio Signals Positive Derivatives Sentiment
Coinglass reported a positive change in the SOL derivatives market. As of May 23, the long/short ratio went up to 1.03, indicating that 50.9% of traders were holding long positions. For the first time in more than a week, longs have remained on top for over 24 hours straight.
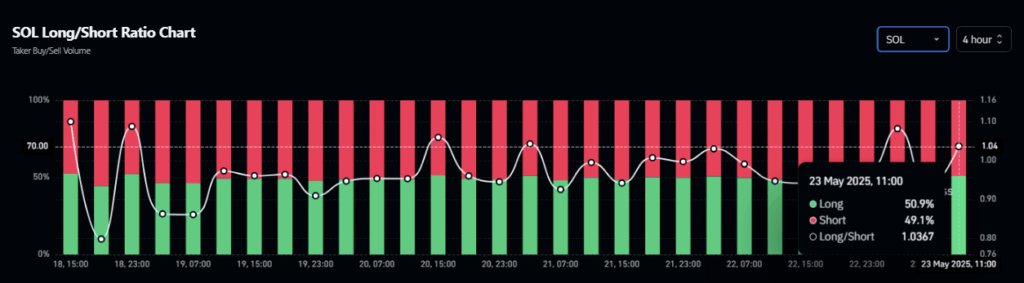
Such a shift in sentiment typically precedes upward momentum. There has been a minor decrease in short interest, and more long traders are showing confidence that the market could break out.
Even though the ratio is still close to zero, the trend indicates more buyers are joining the support for Solana.
Furthermore, if the long bias lasts, short liquidations could help a breakout above $208. Should leverage rise on long positions, it might mean that institutions expect the bullish trend to keep going.
Cup and Handle Pattern Suggests Parabolic Rise
Notably, Ali Martinez outlined the cup and handle pattern, emphasizing its reliability for trading. This structure has taken several years to mature and is close to breaking out of the neckline.
It shows that a close above horizontal resistance could set off a strong move like the parabolic rallies seen before. After a lengthy streak of consolidation, a rounded base is formed, and a short consolidation handle is later formed.
This structure marks new targets higher than earlier levels of resistance. As a result, Solana price is predicted to reach $250 in a short period and $290 in the medium term.
The chart structure aligned with the current trend that is moving upward in lower time frames. When the different patterns coincide, the result is usually rapid changes in price. Investors and traders are waiting to confirm a move above the current SOL high of $208.