

Key Insights:
- HYPE confirms bull flag breakout, validating a short-term price target of $48.40.
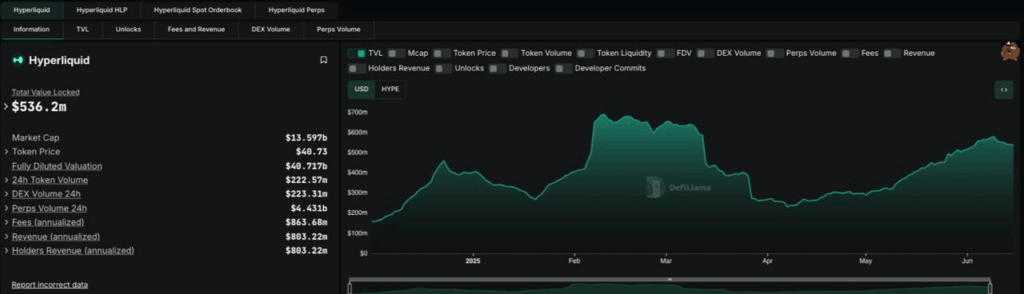
- Strong fundamentals and market activity show over $536M in TVL, $4.43B in perpetual volume, and a 10.4% daily price increase.
- A potential rising wedge pattern may indicate downside risk if support at $42 breaks.
Hyperliquid, $HYPE, has validated a Bullish breakout through a traditional Bull Flag pattern. The breakout has a short-term price upside target of $48.40. According to CoinMarketCap data, HYPE is currently worth $44.14, a 10.4% daily gain.
It broke out following a brief phase of consolidation in a downward-sloping channel. The recent price action during the last few days created a definite flag pole and flag formation. This is considered a continuation pattern in most cases.
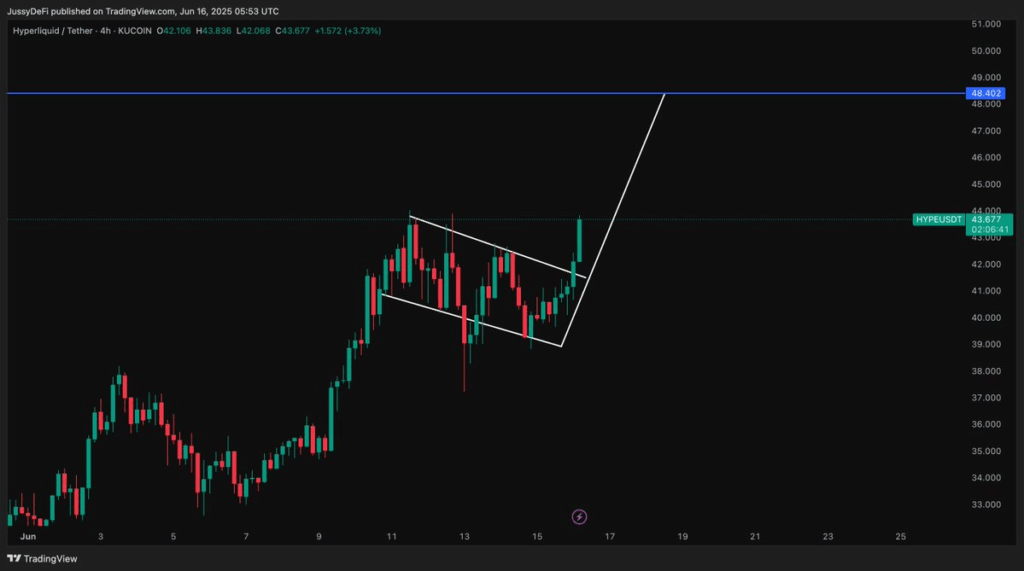
Having broken out decisively above the upper trendline resistance, with, in effect, the area of the upper trendline resistance around $43.
A breakout has been confirmed, and the momentum is in place headed toward the projected resistance at $48.40.
Chart Structure Supports Upside Momentum
It is possible to see a breakout on HYPE based on the 4-hour TradingView chart using the Bull Flag pattern. The token has already broken out of the flag pattern after retesting the $42 support area and moving towards the $43.67 resistance level.
Its technical configuration reveals a BoP clean continuation pattern, where the measured move up the flagpole indicates that the price may go as high as $48.40. The value trajectory is moving towards the expected one.
The volume confirmation on the chart supports the strength of the breakout. Bullish candles with wide ranges and high volumes move in line with a solid push of momentum. This move is after a period of several days of consolidation, which saw the market reset.
A wedge is commonly a bearish formation that may precede a correction. The wedge pattern extends between the low of June 3 at approximately $33 and recent highs topping out above $44. In case it works, the measured target of the wedge would show a down move to the level of 30.
Nonetheless, this is a short-term bullish trend since HYPE is still above the line of support and has not tested a break yet.
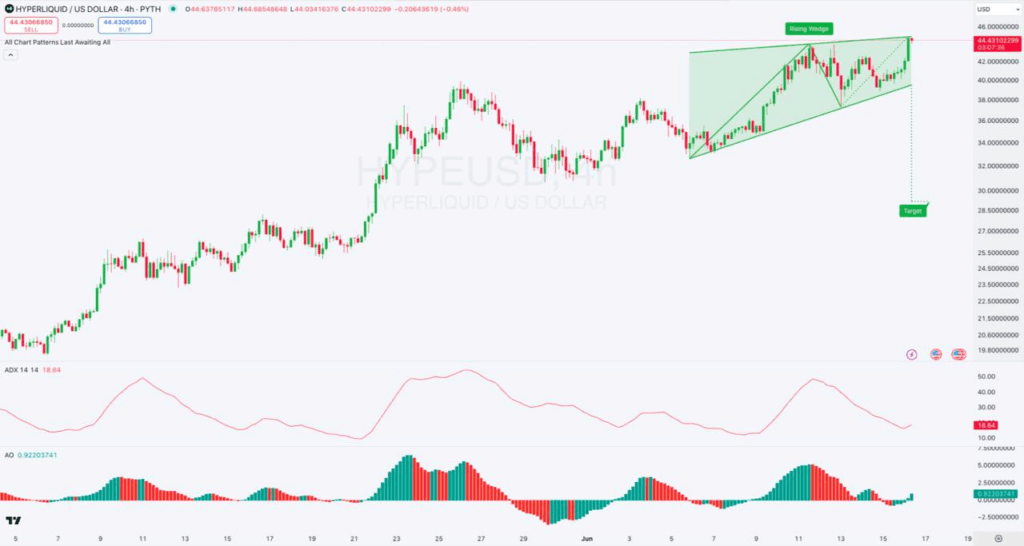
The index has a value of ADX of 18.64, which shows that the trend is weakening. In the meantime, the Awesome Oscillator (AO) indicates short-term bullish momentum since it lies in the green.
On-Chain Metrics Show Growing Strength on Hyperliquid
Hyperliquid also has total value locked (TVL). According to DeFiLlama, the total value locked (TVL) of Hyperliquid equals $536.2 million.
Its 24-hour volume in the decentralized exchange (DEX) is 222,57 million, whereas its perpetual trading volume accumulated a 4.43 bln figure.
The protocol fees annually amount to 863.68 million USD, and 803.22 million USD is the revenue generated by the holders.
Such numbers demonstrate that more people are using it, and its protocols are getting busy. The full-diluted valuation of HYPE has exceeded the mark of 44.41 billion US dollars, and its market cap stays at around 14.74 billion US dollars, which reflects a 10.4% daily growth. According to CoinMarketCap, an increase in trading volume of 36.72 percent during the same period has been indicated. The circulating supply of the token is 333.92 million or a maximum of 1 billion.
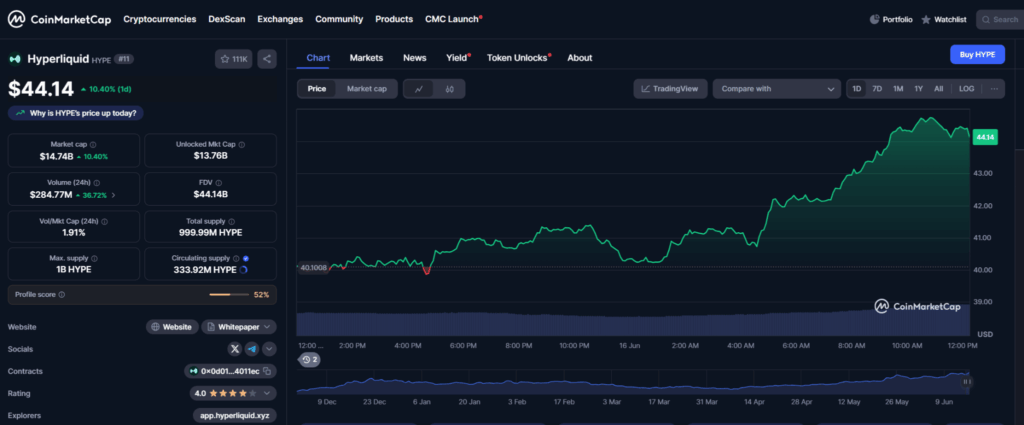
The score of HYPE in CoinMarketCap profiles stands at 52%, which indicates that there is still potential for wider retail activity. The token is the 11th token by market cap, also highlighting its significance as a top crypto asset.
The price chart over each day reveals that HYPE has been steadily increasing all the way to the lower price level of June 10, around $36.50, and is now at the current level, setting a series of new lows.
This positive trend is strengthened by the growing trading volumes, which argue that the given rally exists owing to the influx of new funds rather than short-term volatility.