

- The Pepe coin price prediction suggests that if the ongoing market sentiment remains unchanged, the price could drop to the $0.0000085 mark.
- On-chain metrics indicate that traders remain optimistic and appear confident despite the bearish trend.
Pepe coin price prediction has become a key topic of discussion amid the ongoing geopolitical tensions between Israel and Iran. The daily chart reveals that the meme coin has been trading sideways for the fourth consecutive day at the same level.
On-Chain Metrics Flash Bullish Sign
Despite fear and bearish market sentiment, traders remain optimistic and appear confident, as reported by the on-chain analytics firm Coinglass.
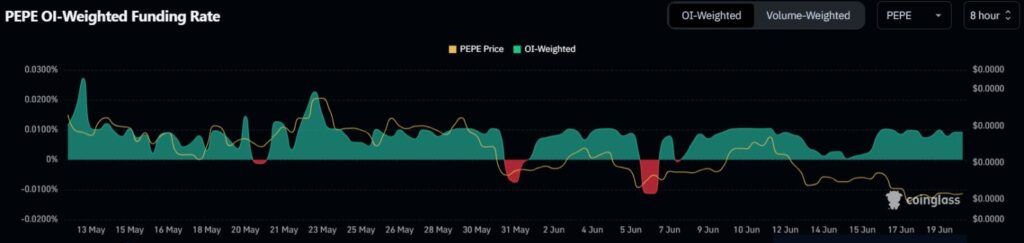
Positive Funding Rate
The on-chain metric, funding rate of PEPE meme coin, remains positive amid the ongoing bearish trend, indicating traders’ confidence, although their interest in the token appears stagnant.
Major Liquidation Levels
At press time, traders are over-leveraged near $0.0000096 on the lower side (support) and $0.00001054 on the upper side (resistance). At these levels, they have built $7.32 million worth of long positions and $4.79 million worth of short positions.
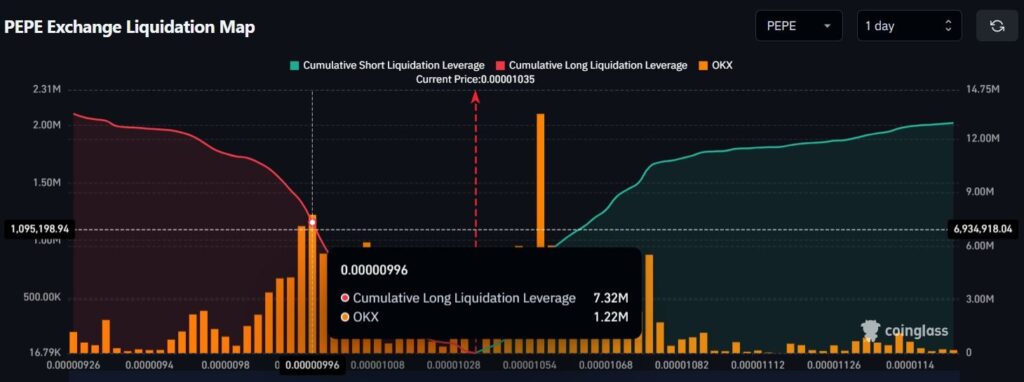
These bets clearly demonstrate bullishness and optimistic sentiment among traders, indicating that bulls are currently dominating the asset and appear to be pushing the meme coin’s price to initiate upside momentum.
$15.40 Million Worth of PEPE Outflow
Meanwhile, investors and long-term holders have also been found accumulating the meme coin, as revealed by Coinglass.
Data from spot inflow/outflow shows that exchanges across the crypto market have recorded an outflow of $15.40 million worth of Pepe meme coin.
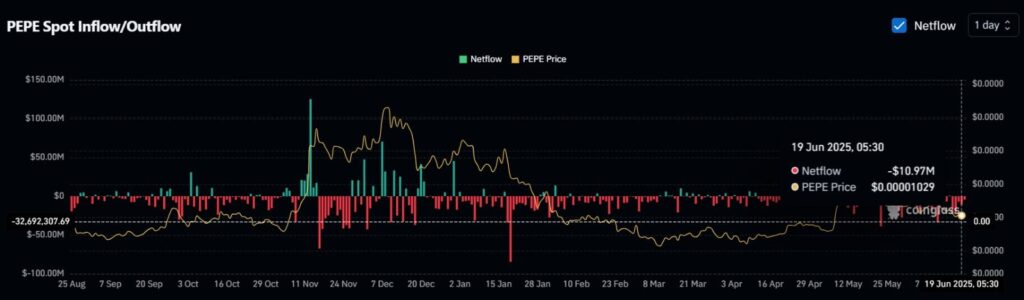
This substantial outflow from exchanges suggests potential accumulation by investors and long-term holders, which could lead to buying pressure and further upside momentum.
When combining these on-chain metrics with technical analysis, it appears that bulls are currently pushing PEPE to end its prolonged downside momentum and initiate a fresh upside rally.
Current Price Momentum
At press time, PEPE was trading near $0.00001034 and had experienced a modest 0.85% price dip over the past 24 hours. During the same period, trader and investor participation plummeted, resulting in a 37% drop in trading volume.
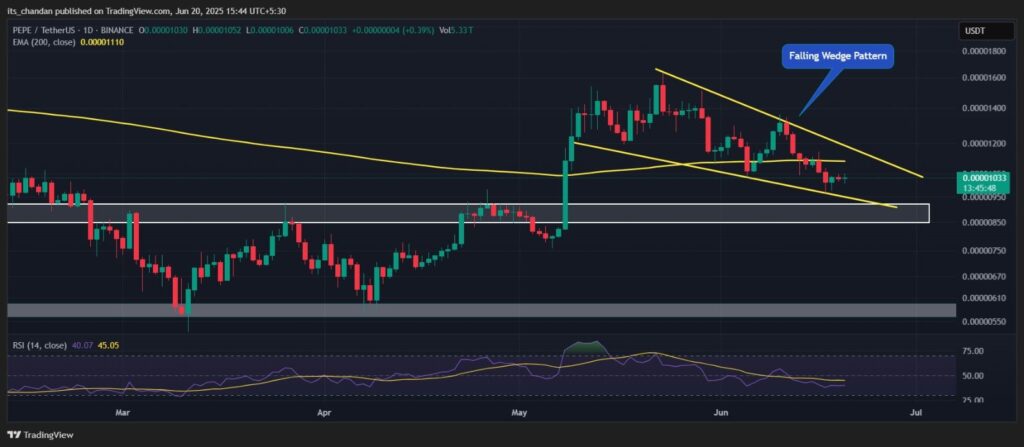
Pepe Technical Outlook, Signs of a Reversal?
According to expert technical analysis, the PEPE coin price prediction appears bullish. Currently, it suggests that it may remain sideways until a major move, either to the upside or downside, emerges in the coming days.
PEPE has been moving in a tight consolidation zone for four consecutive days. However, this ongoing price consolidation and recent downside momentum appear to be occurring within the lower boundary of a bullish falling wedge pattern on the daily time frame.
Pepe Coin Price Prediction
Additionally, PEPE appears to be holding at a key support level of $0.0000090. Based on recent price action and historical patterns, if the ongoing market sentiment remains unchanged, the Pepe coin price prediction suggests that the meme coin could experience a notable drop and may reach the next key support at $0.0000085 in the future.
On the other hand, if sentiment shifts and upward momentum continues—breaking the ongoing consolidation—the Pepe coin price prediction suggests that the meme coin’s upward momentum could accelerate, potentially pushing the price toward the $0.000012 level.
Technical Analysis: RSI and 200 EMA
With these ups and downs, PEPE’s Relative Strength Index (RSI) stands at 40.07, suggesting weakening bullish momentum and a growing dominance of sellers in the market.
While the RSI is not yet in the oversold zone, it signals that investor confidence is fading, and if the metric continues to drop below 30, it could trigger a potential reversal or a period of price consolidation.
Whereas, the asset is still trading below the 200-day Exponential Moving Average (EMA), highlighting a long-term bearish trend and indicating that bulls must retain significant momentum to shift the market structure toward recovery.