

Key Insights:
- Descending wedge and double bottom signal possible bullish reversal ahead for the PI crypto value.
- Volume metrics show declining sell pressure near the historical support zone.
- A breakout above $0.64 could confirm a shift in the PI/USDT trend.
The PI crypto value is experiencing a sharp fall toward the $0.49 mark after a stable move at the local May peak of more than $1.65.
Although volatility and bearish attitudes have continued to dominate the market, the recent chart arrangements indicate that PI/USDT is closer to a technical turning point.
12-hour charts indicate a clear pattern of a descending wedge, which is a bullish structure. In most cases, it appears following the downtrend and signifies the possible movement of the price.
The wedge starts in early May at the mark of approximately below 1.65 and narrows till late June, reaching approx below 0.50 area. The bottom of the wedge coincides with horizontal support at 0.4047, a level that was used as a rebound point twice in the last four months.
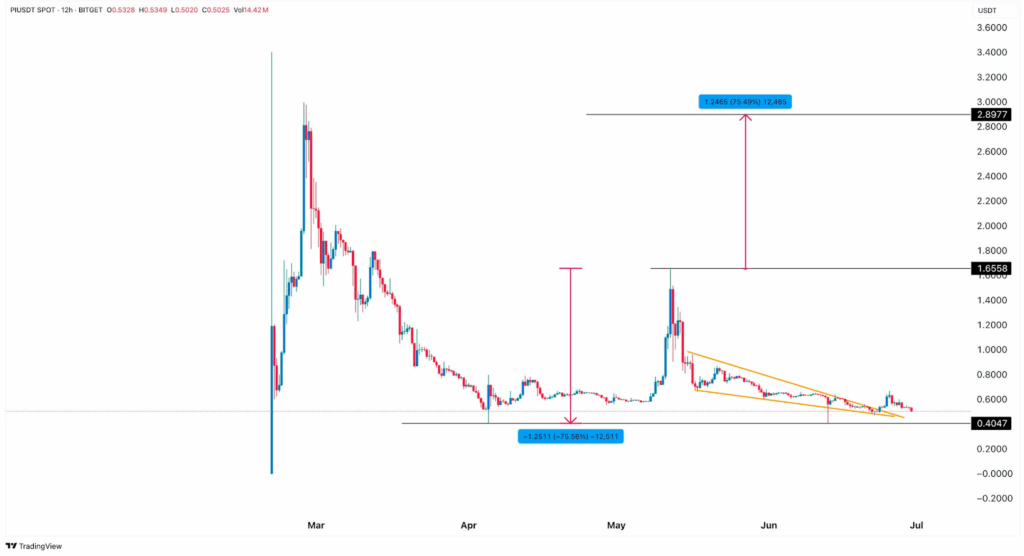
This makes it look like a traditional double bottom formation. The intersection of the trends indicates a possible consolidation and probable breakout with a helping hand of volume and the overall market behavior.
PI Crypto Value Contraction Mirrors Prior Volatility Extremes
Later on this year, PI/USDT, which was trading at a high of around $1.65 and a low of 0.40, saw a huge fall of 75.56%. After that, a sudden comeback resulted in a symmetrical 75.49 percent bounce to the upside to $2.9,0, only to retreat again.
These up-and-down price moves in a vertical fashion indicate the sensitivity of the token to both momentum and macro triggers, which provide the context to the ongoing tight price range.
Today, the relative price action has become closer, in the form of a wedge; hence, historical volatility can be considered as a guideline.
Confirmations of breakouts of such tightening patterns are likely to show similar percent moves before the breakout, indicating price action might retrace previous highs should certain volatility re-enter the price action.
Liquidation statistics provided by CoinGlass show that the greatest liquidations in longs were at the period of March 14, which was the high of $2.50.
The liquidations went through the roof during that window, with the price reaching skyrocketing levels before crashing down hard.
Although short liquidations were observable towards the end of the month in February, they were small in comparison with the huge burst of long positions, created and outpaced in the middle of March.
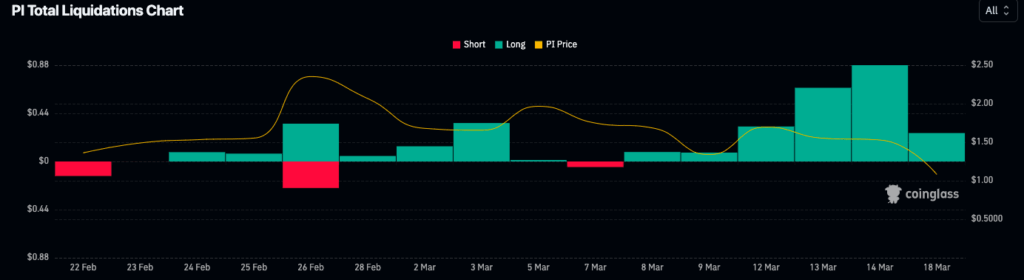
Liquidations have been weak and declining in their amplitude since the end of March (both short and long). This cooling liquidation exercise points to lowering of speculative leverage within the system, a circumstance which can usually be followed by the development of more structurally sound foundations.
The current flat to sliding PI price of this time only strengthens this explanation, since even fewer traders now would like to bet too much one way or the other, and perhaps they are waiting to see some event.
Short-Term Trend Channels and Support Zones Hold on Lower Time Frames
Looking at 4-hour charts, we see a descending parallel channel that begins with the June peak at the price of 0.64 and reaches the current small range of 0.49 rates.
This falling channel has dictated the direction of prices since more than two weeks back and it is headed to a blue marked demand zone between 0.44 and 0.47, which was a previous support zone on June 22.
The fact that volume data on this chart confirms fading selling pressure. Volume Oscillator (5,10) indicates -16.49% at the moment, which means that the sellers do not show vigorous actions after the decrease of prices was experienced.
On the same token, the Volume Delta has rolled over to 1.55K, a very dramatic change to the extreme selling volume spikes seen through mid-June.
The volume fading before important support coincides with the usual traits of a possible local bottom, but this still needs to be confirmed.
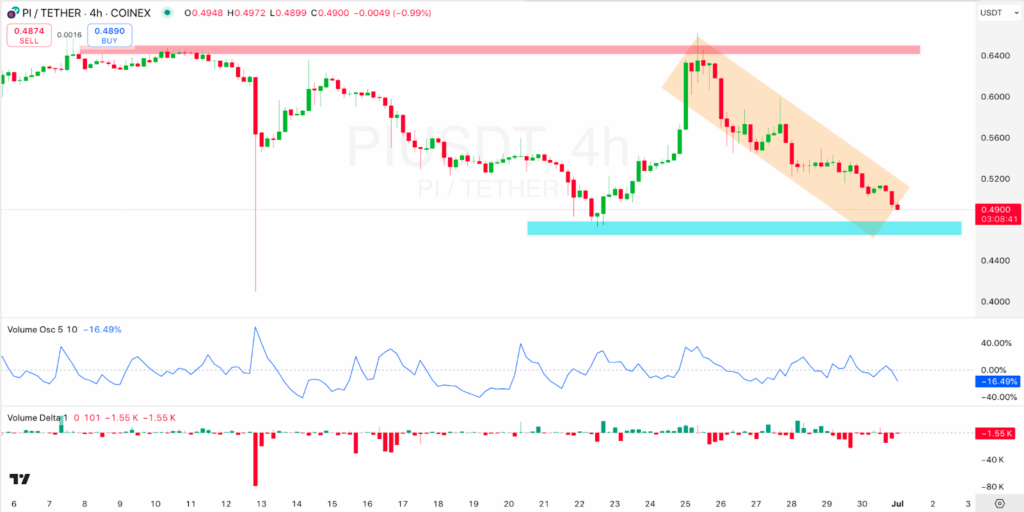
Technically, the overall picture is laid by the descending wedge pattern together with the two-bottoms formation, but a breakout is confirmed only after a significant price roll above the existing resistance line at the price of $0.64. The area was used in late June to reject, and it became the top of the 4-hour bear channel.
To maintain a rally, the PI/USDT should also regain some volume involvement, hopefully a positive delta, and support by increased volume oscillator.
Closing mildly above $0.64 on good volume cancels the existing downtrend and may create space to achieve $1.65 as the next resistance that has been created on the 12-hour chart, and later to achieve $2.90, indicating a rally of 75% off current levels.
Until then, the Pi crypto value between $0.4047 and $0.64 stands unchanged. as of yet, no decisive move has taken place confirming the trend of breakout by market bulls.
But the market is calm at the long-term support, and this indicates a market that is waiting, which is also common before big directional moves.