

Key Insights:
- The BONK coin price could surge over 40% if it closes a daily candle above the $0.00001840 level.
- Traders are currently over-leveraged at $0.00001646 on the lower side and $0.0000185 on the upper side.
After experiencing notable downside momentum, the Bonk coin price is now signaling a potential recovery with a looming bullish breakout on a daily chart. Since May 2025, the meme coin has lost over 45% of its value, but signs on the daily chart suggest it is poised to reclaim lost ground.
Current Price Momentum
As of writing, BONK is trading near $0.00001778 and has recorded a price surge of over 4.75% in the past 24 hours. Amid the ongoing price recovery, traders and investors have shown strong interest in the meme coin, resulting in a 10% surge in trading volume.
This surge in trading volume comes as the meme coin posts a notable gain, indicating that BONK is in a strong bullish uptrend. Additionally, it also suggests the potential for an upside rally.
BONK Price Action and Technical Analysis
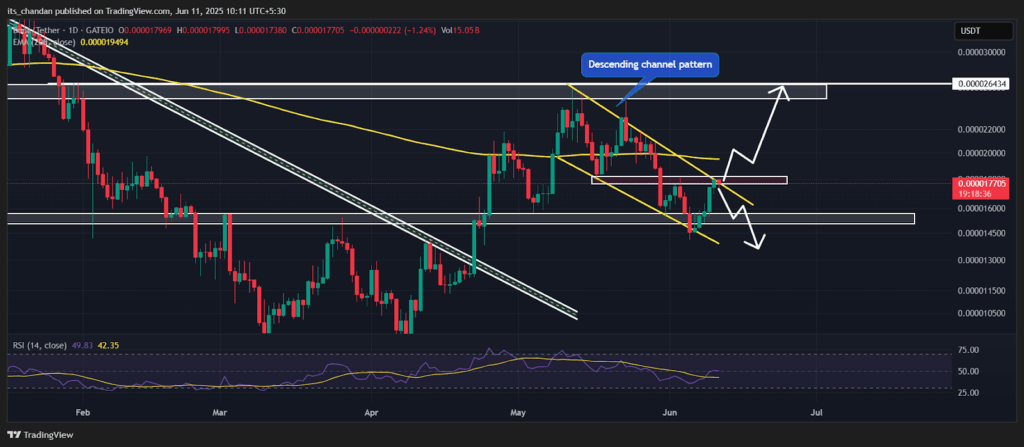
According to expert technical analysis, the BONK coin appears bullish and is currently in a make-or-break situation. The daily chart reveals that since May 2025, the meme coin has undergone a price dip of 45% while forming a descending channel pattern.
However, so far, the BONK coin price has recovered 22% and reached the upper boundary of the channel, which appears to be acting as resistance. Additionally, the price level where BONK is facing resistance aligns with a horizontal resistance zone at $0.000017894.
As per the historical chart pattern, the last time the BONK coin price reached this level, it faced selling pressure and recorded a 20% decline. However, that occurred during a period of overall bearish market sentiment, whereas now, the sentiment has significantly improved.
BONK Coin Price Prediction
Based on recent price action, if the current upside momentum continues and the BONK coin price breaks out of the descending channel pattern, it could see a further upside rally.
According to the daily chart, if a breakout occurs and a daily candle closes above the $0.00001840 level, there is a strong possibility that the BONK coin price could surge over 40% and reach the $0.000026 level in the near future.
On the other hand, if the sentiment weakens and the price fails to break out of the descending channel pattern, there is a strong possibility that history will repeat itself and the BONK coin price will experience downside momentum.
In addition to the BONK price action, its Relative Strength Index (RSI) on the daily time frame currently stands at 49, indicating a neutral zone where neither buyers nor sellers have a clear advantage. However, there is growing potential for a bullish reversal if momentum builds.
On-Chain Metrics Flashes Bullish Signal
Given the current market sentiment, BONK’s investors and traders seem optimistic, as they have been observed accumulating and betting on the meme coin, according to Coinglass.
Exchanges Continue to Record Outflow, Are Whales Buying?
Data from spot inflow/outflow reveals that exchanges have witnessed an outflow of over $848K worth of BONK meme coins over the past 48 hours.
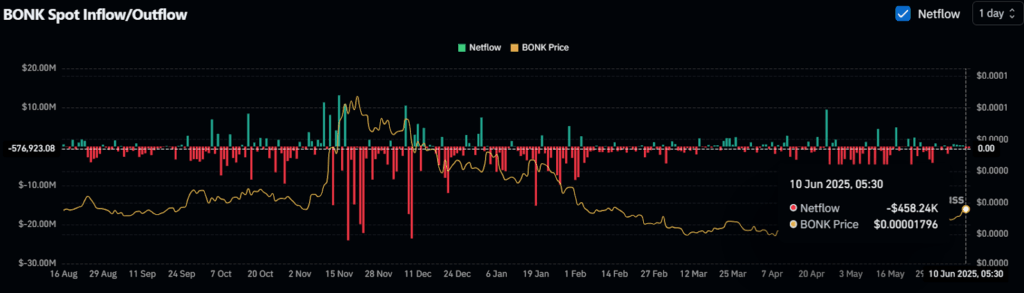
Such an outflow, occurring while the price is on the verge of a breakout, suggests potential accumulation by investors and long-term holders, likely contributing to buying pressure and further upside momentum.
Traders’ Eyes on the Long Positions
On the other hand, traders appear to be aligning with the current market sentiment.
On-chain metrics reveal that traders are currently over-leveraged at $0.00001646 on the lower side (support) and $0.0000185 on the upper side (resistance).
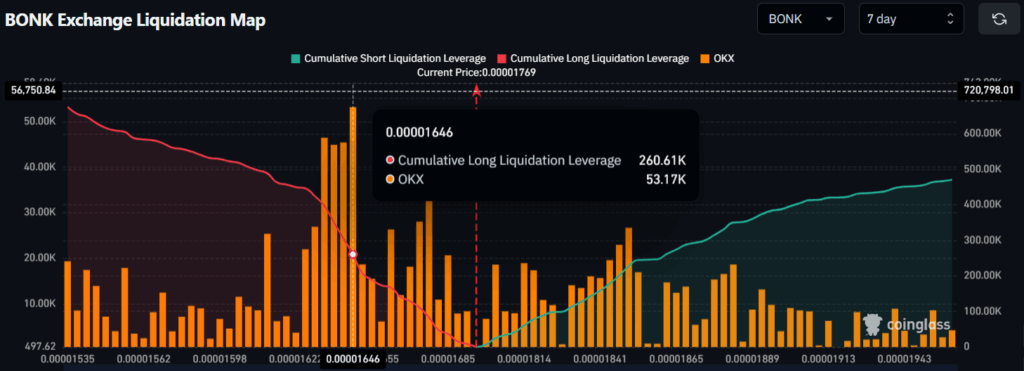
At these levels, they have built $260K worth of long positions and $210K worth of short positions, clearly indicating that bulls are currently dominating the meme coin, which could support its upside momentum.