

Key Insights :
- Chainlink price has neared key $12.30 support; a break below could trigger a drop toward $8.
- RSI below 30 signaled oversold conditions, but no reversal pattern has been confirmed yet.
- Futures volume was down 25%, OI was down 8.6%, and traders exited their positions amid uncertainty.
Chainlink (LINK) has traded in a crucial support zone, hovering around $13.71 after a multi-day decline. Bearish momentum is pressuring the crypto market.
Chainlink price prediction now focuses on whether bulls can defend the $12.30 level. LINK’s price action depends on its strength at this key support.
According to analyst Ali_Charts, a break below this area could push LINK toward the $8 range. With technical signals flashing weakness, all eyes are now on buyer reaction at this level.
Support Zone at $12.30 in Focus as Bearish Pressure Builds on the Chainlink Price
LINK has been declining steadily from a recent high near $17 and is now approaching the $12.30 area. This level aligns with the 0.5 Fibonacci retracement from the $5.17 low to the $27.46 high. Chainlink price prediction highlights it as a key area of interest.
According to technical analyst Ali, LINK has been trading within a long-term ascending channel. The price is now nearing the lower boundary of this channel.
There, support at $12.30 could offer temporary relief. “A break below this support could open the door for a drop to $8,” the analyst said.
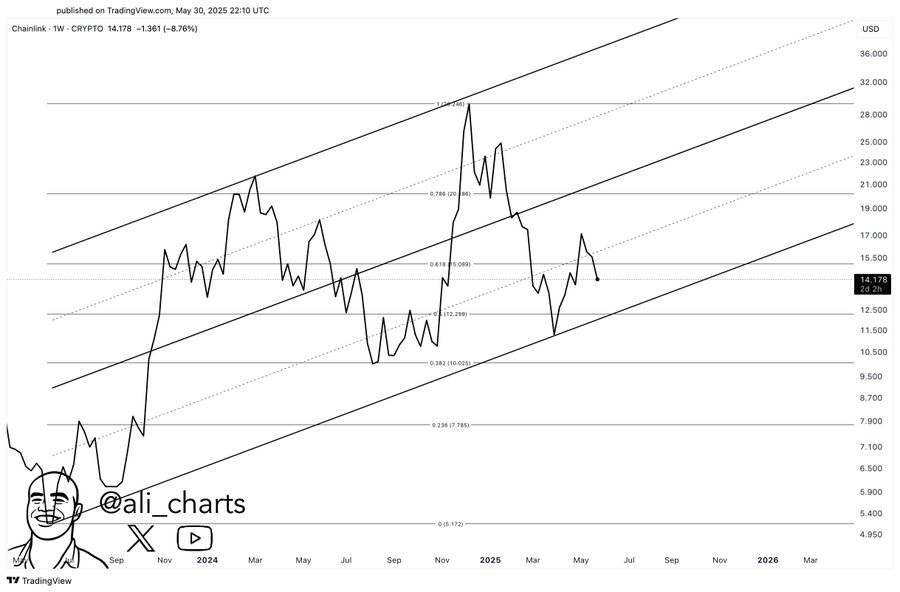
On the 1-day chart, price structure shows lower highs and lower lows, indicating a short-term bearish trend. This breakdown from the $15.00–$16.00 resistance area has left traders cautious.
A failure to defend $12.30 could invalidate the channel structure and shift LINK into a deeper retracement.
Volume Declines While Derivatives Show Mixed Sentiment for Chainlink Price
24-hour trading volume for LINK has dropped by nearly 11%, showing declining interest from traders. Low participation suggests uncertainty about the near-term trend. Chainlink price prediction now focuses on the key $12.30 level.
According to data from derivatives platforms, open Interest in LINK futures has also decreased by 8.68%. This suggests that traders are closing positions and reducing risk, rather than building new directional bets.
The long/short ratio across exchanges remains slightly in favor of longs. However, recent liquidations indicate that bulls are under pressure.
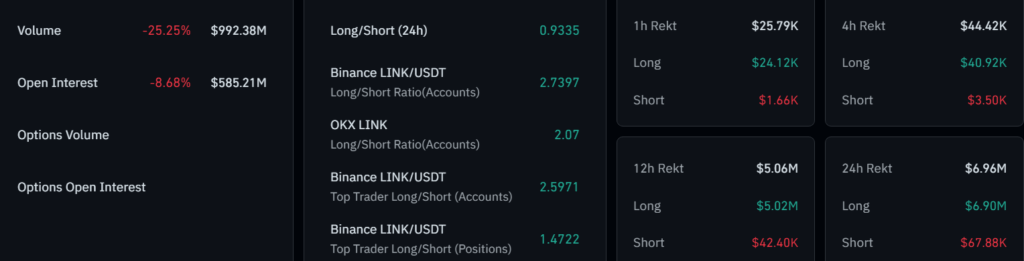
On Binance and OKX, most traders remain long on LINK. However, liquidation data shows that more long positions have been closed over the last 12 hours.
These liquidations are likely the result of failed attempts to defend levels above $14. This behavior confirms that bulls have lost short-term control of the price.
Indicators Reflect Weak Momentum and Oversold Conditions
Multiple technical indicators suggest that LINK’s bearish trend may still have room to continue. However, oversold conditions raise the possibility of a short-term bounce.
On the 4-hour chart, the Relative Strength Index (RSI) has dropped below 30, suggesting the asset is oversold. However, no bullish divergence has been confirmed yet, which means momentum remains with the sellers.
The Bollinger Bands are contracting, showing reduced volatility. Price is currently hugging the lower band, often a sign that the asset is trending with no strong counterpressure. If volatility expands while price remains below $13.50, a sharper move downward is possible.
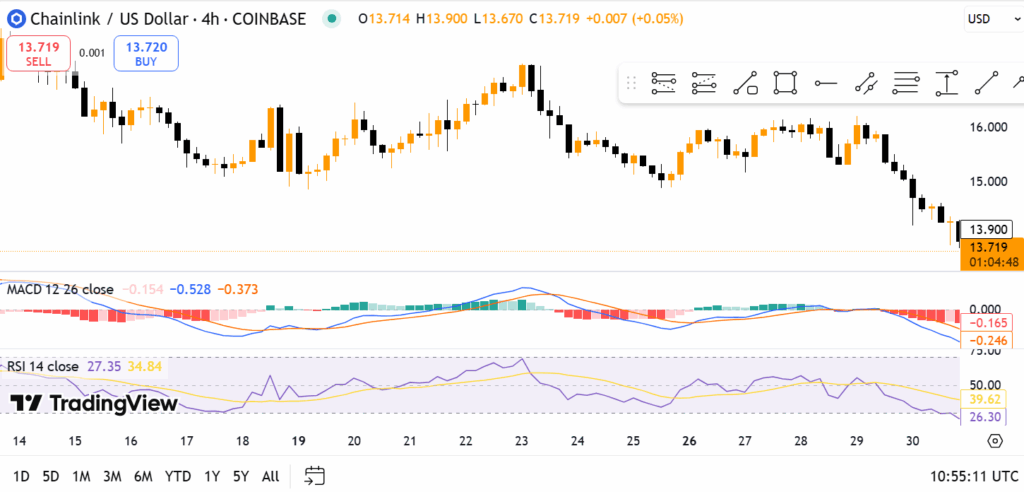
The Awesome Oscillator (AO) also prints red bars below the zero line. This indicates that negative momentum has not yet reversed. A switch to green bars or a bullish crossover in MACD could offer early signals of recovery, though none have emerged at this stage.
Outlook and Market Strategy Moving Forward
With declining short-term indicators and a drop in trading volume, LINK will most likely respond this way when it gets to $12.30. If there is significant buying pressure, the price might try to climb back above $14.50.
A drop of more than 14% reaching $12.30 or less on a daily close could result in further losses that might turn LINK toward $10 or $8. Before taking a long position, traders search for signs like a bullish engulfing candle or RSI divergence.
LINK’s price is also determined by the changes within the crypto industry and movements in Bitcoin. Until the situation is confirmed, the market is supposed to react to levels as they appear.