

Key Insights :
- Dogecoin reached a key resistance but breaking above, would see DOGE target around $0.40.
- Dogecoin’s RSI MA readying to climb to the top which could lead to a parabolic surge.
- The activity on the Dogecoin network exploded, with 127,570 active addresses.
A Dogecoin (DOGE) forecast analysis suggested that the meme coin could poised for uptrend continuation upon breaking above $0.25 level.
Dogecoin Forecast
A Dogecoin forecast analysis showed the meme coin was unable to overcome a critical point of resistance at $0.25 as the price action considered, and the price fell into a consolidation channel.
This region always played a role of a powerful rejection zone, at least back in February, and reaffirmed itself.
A line of the wicks and skinny candles indicated indecision to emphasize once again that DOGE might consolidate up in the short run.
A little correction up to $ 0.23 may provide a possible higher low form within the ascending trendline. If price breaks out above $0.25 with strong volumes, it may scale up to the next major resistance at $0.40.
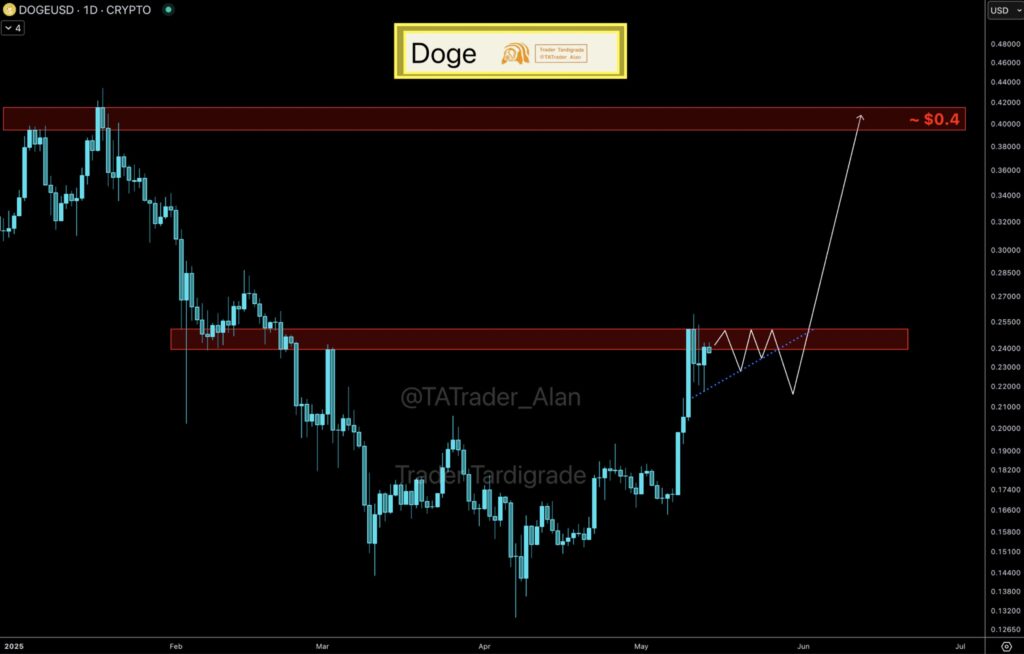
This level matched the upper levels, which was why it was one of the primary targets of bulls.
On the other hand, the failure to break above the $0.25 may undermine the bullish structure and lead to a correction down to the $0.20 area.
The consolidation would be valid between $0.23–$0.25 as long as the higher lows were formed. If this could be maintained, it would signify strength and possibly a bullish breakout.
In the future, the next big directional move for DOGE would be dependent on whether the price would flip $0.255 to support.
Why Dogecoin’s RSI is Key?
Meanwhile, the RSI MA of Dogecoin crossed upper levels, copying the similar configuration that had been seen throughout the October 2024 parabolic.
Bull’s vitality returned, as the strong bullish bend of the RSI moving average showed.
If the momentum is maintained, then DOGE may return to the previous highs around $ 0.50 as depicted by the price projection zone.
A green RSI cross historically led to explosive runs, and the recent pattern revealed early stages of that repeat pattern.
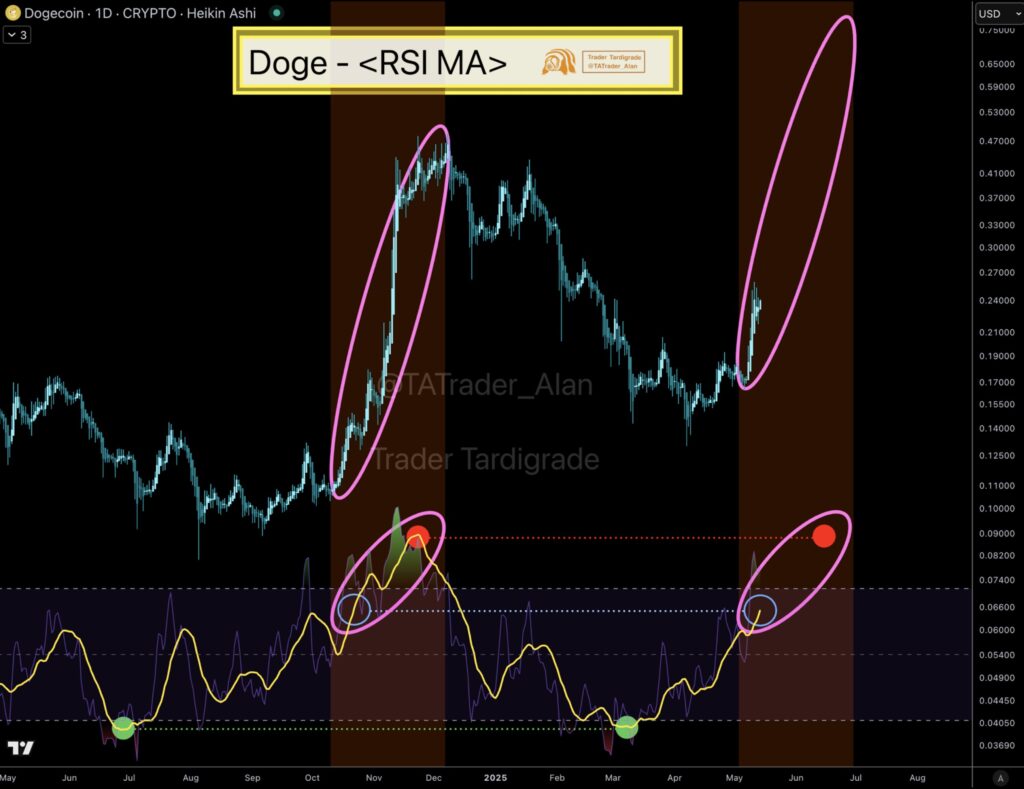
However, RSI touched the resistance zone where it had peaked before some massive reversal. If the RSI became flat or even moved in opposite directions, DOGE could lose steam and fall.
The candles confirmed the strength of a persistent uptrend, but traders needed to keep an eye out for candle switching.
In the future, a prolonged RSI slope at the top may imply continuation to $0.40, and divergence around this top could send the market back to levels of support.
Dogecoin Network Activity
Meanwhile, the network activity of DOGE skyrocketed, registering 127,570 active addresses. This was a huge increase from the 59,000 addresses recorded earlier.
The chart showed that address activity had been growing steadily, with a very rapid surge since May 7.
The amount of activity attested to the increased user engagement, particularly when the price was $0.17 on May 7, and on May 13, it reached $0.24.

This increase in address count pointed to increased activity on the network, which may be a sign of increasing interest from investors or high trade volumes.
In the past, such on-chain spikes were predictive of price volatility, either up or down.
If the engagement was maintained at a rate of more than 120,000 addresses, DOGE may maintain the momentum to break above $0.25 and even higher.
But a sudden fall in active addresses may simply indicate short-term speculation cooling down and therefore a retracement in price.
A sustained demand for more than 100,000 addresses could serve as the bullish support for DOGE’s valuation.