

Key Insights:
- Dogecoin price targeted $0.21 as a falling wedge breakout and wave count support rally setup.
- Trader Tardigrade’s chart showed DOGE repeating wedge patterns above 600-day support.
- Reclaim of $0.163 strengthened bullish case, with the next breakout zone near $0.167–$0.172.
Dogecoin price has reclaimed strength above $0.163, with analysts projecting a move toward $0.21. This recovery is based on a falling wedge breakout along with a reaffirmation of bullish trends backed by wave structure models and important charts. A possible multi-leg rally gain is now developing.
Dogecoin Price Breaks Out as Analysts Target Wave 1 at $0.21
Dogecoin price has risen from a local low of $0.14270 to $0.1638, reclaiming support in the mid-range. According to Nology, DOGE price has completed a smaller degree wave 1 and is building toward a broader five-wave impulse.
In his analysis, the 2021 high marked wave 3 of an ongoing Elliott pattern with the rally a continuation of the new bullish trend.
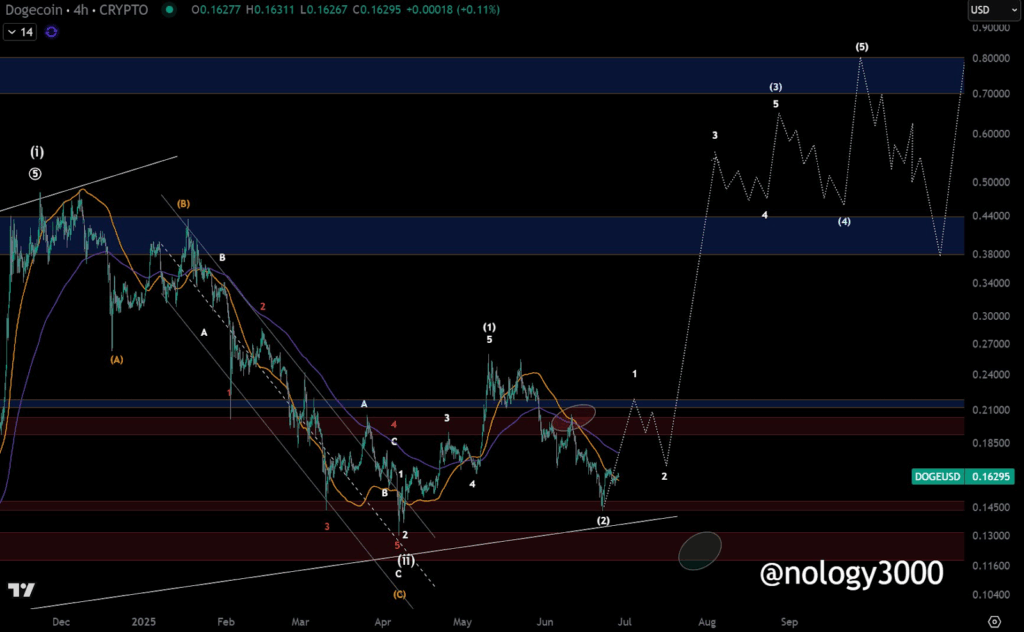
The next immediate milestone is wave 1 at $0.21. The short-term resistance is held at $0.167, although further momentum can be induced by a clear break above $0.16307.
The 4-hour chart of Nology also described wave developments beyond the $0.30, to include a third wave that can reach $0.44 or even up to $0.80.
DOGE price action confirms a technical shift after weeks of correction. The structure is showing higher lows, rising from oversold levels, and testing breakout zones. Traders are awaiting confirmation of volumes before a lasting push is launched.
Falling Wedge Pattern Strengthens Long-Term Bullish
Reinforcing the technical setup, Trader Tardigrade shared a macro chart showing Dogecoin price repeatedly forming falling wedge patterns.
These formations have previously occurred at long-term support areas and have had large upward breakouts.
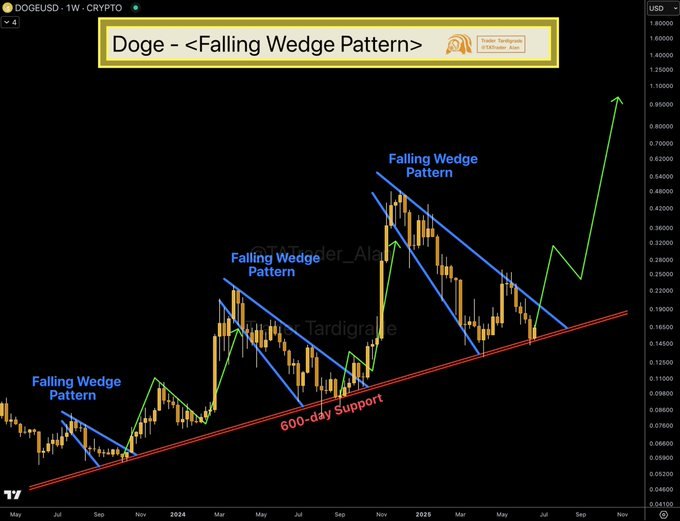
The existing wedge pattern is placed above an ascending 600-day support trendline. According to the weekly chart, each falling wedge over the past three years resulted in a bullish breakout.
This latest formation mirrors those prior setups, suggesting DOGE price may be preparing for another exponential move.
The wedges presented a consistent pattern, that of cyclical consolidations, which is a typical feature of assets that have huge retail demand and long holding times.
Every wedge compressed the volatility to be followed by an expansion period, which is typically catalyzed by news or a volume explosion.
This formation is in conjunction with the wave theory that is being formed, indicating a possible convergence of multiple technical indicators.
The chart’s projected path signals a steep upward move, possibly beyond $0.30 in the coming months if patterns hold.
DOGE Buyers Regain Control
Furthermore, BitGuru noted that Dogecoin price has reclaimed the $0.16199 zone after bouncing from $0.14270.
The top meme coin is currently trading in the mid-range between $0.16 – $0.17. There is a chance of gaining further momentum as buyers overcome resistance at $0.167.
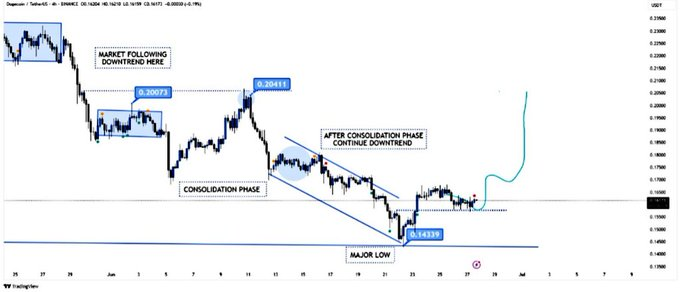
BitGuru identified $0.16307 as the short-term pivot level. The validation of the bullish continuation to the $0.172 and possibly to the $0.21 area might be brought by a close above this area.
Although volume lags at $353.61 million, market cap holds steady at $24.55 billion, which implied consolidation in strength.
Recovering the mid-range following a severe correction is a bullish sign that puts forth accumulation.
Combined with historical chart patterns and wave analysis, it positions DOGE price for potential price discovery if buyers maintain control above resistance.
DOGE Structure Points to Accelerated Expansion
Dogecoin’s multi-timeframe charts reflected an emerging macro-technical alignment. The break of the falling wedge, the Elliott Wave count of the cycles, and the reclaim of support areas give basis to a sustained trend upwards.
Each analyst’s chart contributes a different layer, yet all converge on the $0.21 target as the next key milestone.
The macro-bull narrative entailed a multi-legged rally, in which the current price action is only the initial push.
To confirm a breakout, it has to be followed through beyond $0.167, and also an increase in volume. When this happens, momentum may propel the token into the expansion regions.
Dogecoin price is now at a technical point. Assuming that similar tendencies and wave setups recur, the coming several sessions may characterize the beginning of a deeper trend, attracting the corresponding attention of traders, along with a long-term build-up.