

Key Insights:
- Ethereum price may hit $4,000 if it confirms a breakout from the daily bull flag formation.
- Ascending triangle breakout points to $3,200 as ETH price trades near $2,700 resistance.
- ETH gained 40.08% in Q2, outperforming BTC’s 32.31% amid strong bullish momentum.
Ethereum (ETH) price may be preparing for a major price breakout as technical indicators flash bullish signals.
Some analysts believe that $3,000 can be reached, and there is potential to reach $4,000 as well. Ethereum gets additional support from the robust data in the latest quarterly reports.
Ethereum Price Sets Bull Flag Target at $4,000
Ethereum price has formed a bull flag on the daily chart, with analyst Trader Tardigrade identifying $4,000 as the pattern’s technical target.
Usually, a bull flag is seen when the price is rising strongly. The pattern consisted of a strong price surge and then a consolidation between narrow up and sideways boundaries.
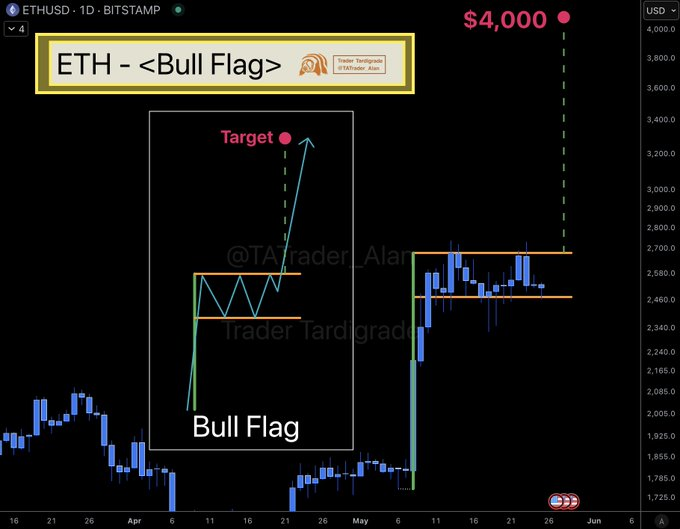
Right now, prices are between $2,500 and $2,700, holding just beneath resistance. The top of the flag is resisting the rise, but the base of the pattern is still acting as support. If ETH price breaks above $2,700 with volume, the pattern suggests an upside target of $4,000.
During the formation of the flag, there has been a noticeable decrease in volume, like what is often seen in this particular setup. If both the resistance line is overcome and volume rises, it signals with high likelihood that prices will continue rising.
Ascending Triangle Structure Points to $3,200 First
Mikybull Crypto pinpointed an ascending triangle on the Ethereum chart. This structure is characterized by higher lows and a flat resistance line around $2,700. If the price of an asset breaks past the top of the ascending triangle, it is seen as bullish.
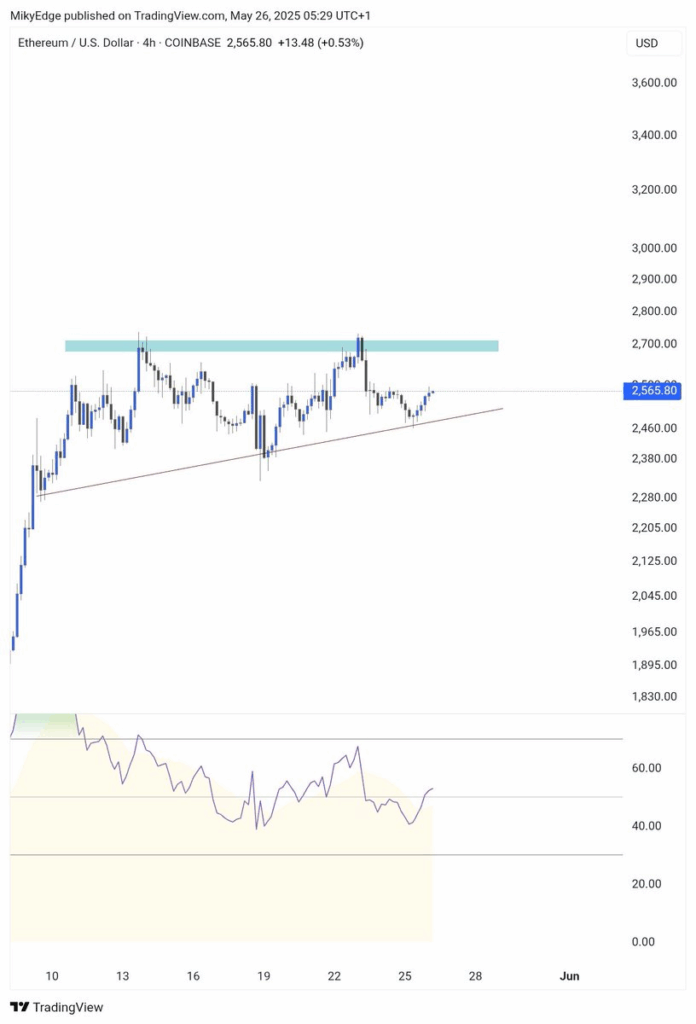
The triangle’s measured move points to a target of $3,200 if ETH price breaks out with strength. The level is crucial for both traders and makers, as it is a likely area for taking profits before targeting a higher point.
On the same chart, the Relative Strength Index (RSI) has swung up from the neutral zone and is now pointing toward the bullish part of the reading. This indicates improving momentum. If RSI remains over 60, the breakout would gain even more strength.
ETH Bull Flag Continues as Price Reaches Parabolic Curve
Bitcoinsensus has observed that ETH price is getting close to a point where the bull flag and the parabolic trend curve meet.
The chart showed ETH price steadily following this parabolic support since mid-April, with each touch leading to a new impulse.
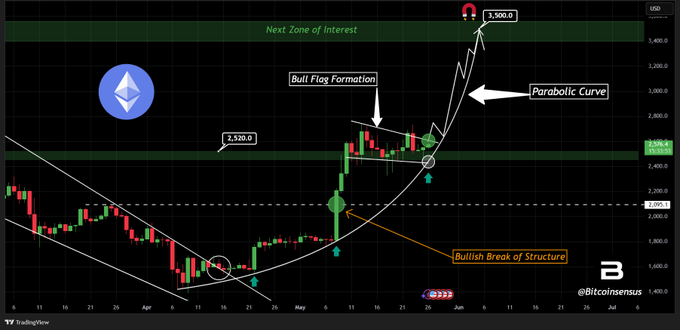
Given this setup, there is a good chance that ETH will have a powerful move if it breaks out soon. Bitcoinsensus continues to predict a rise to $3,500, confirming it as the next level to watch. The chart reflects that the previous bullish signal was maintained when prices increased.
If Ethereum price can maintain price action above the parabolic curve and pierce the flag’s top, the $3,500–$4,000 range could be reached in a relatively short time.
The increase in trend is more convincing if the parabolic curve appears with rising volume and positive mood among market participants.
Ethereum Leads Q2 With 40% Gains
ETH has gained more in value than BTC during the second quarter of 2025. Based on the quarterly data provided by Coinglass and Kyle Chassé, Ethereum has achieved a 40.08% increase in quarter 2.
During the same period, Bitcoin made a 32.31% gain. This reinforces ETH’s growing dominance during bullish mid-year cycles.
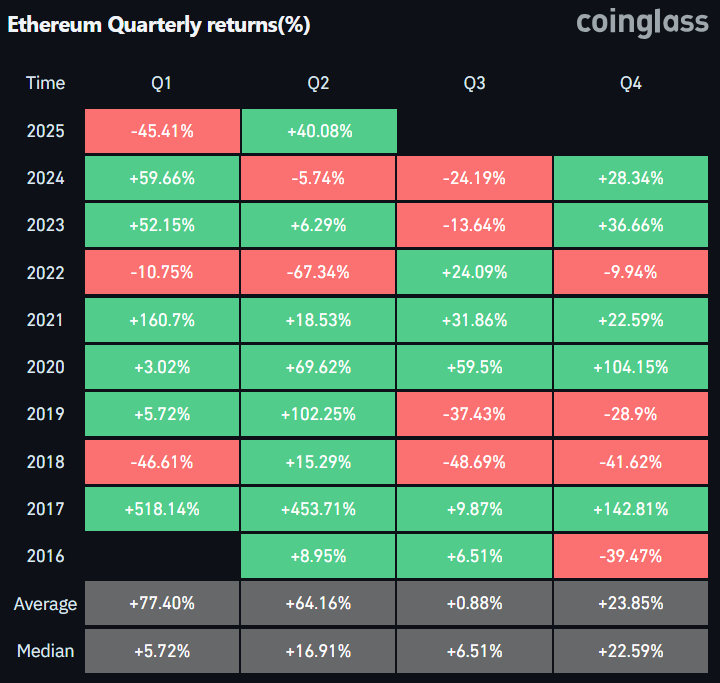
Ethereum price has achieved its biggest gains often during Q2 and Q3. In 2020, ETH gained over 45% in Q2. In 2021, Q2 returns exceeded 160%. The continuous rise in prices coincides with the technical events seen on the charts.