

Key Insights:
- Ethereum (ETH) price breaks wedge pattern, holding firm above key support levels.
- Bullish sentiment rises across retail and smart money investor groups.
- The following resistance zones are $1,900 and $2,250 for ETH.
Ethereum price maintained its position above $1,800. On the other hand, the analytic data implied the start of bullish trends among retail traders and institutional investors.
Technological strength is visible as the Ethereum price moves above historical support lines after breaking from a declining wedge pattern.
At press time, Ethereum was holding a price level of $1,825. Its trading volume has surpassed $15.6 billion, while its market capitalization is $220.4 billion.
Analysts confirm bullishness from retail and institutional investment sentiment, corresponding directly with analysis from multiple technical indicators.
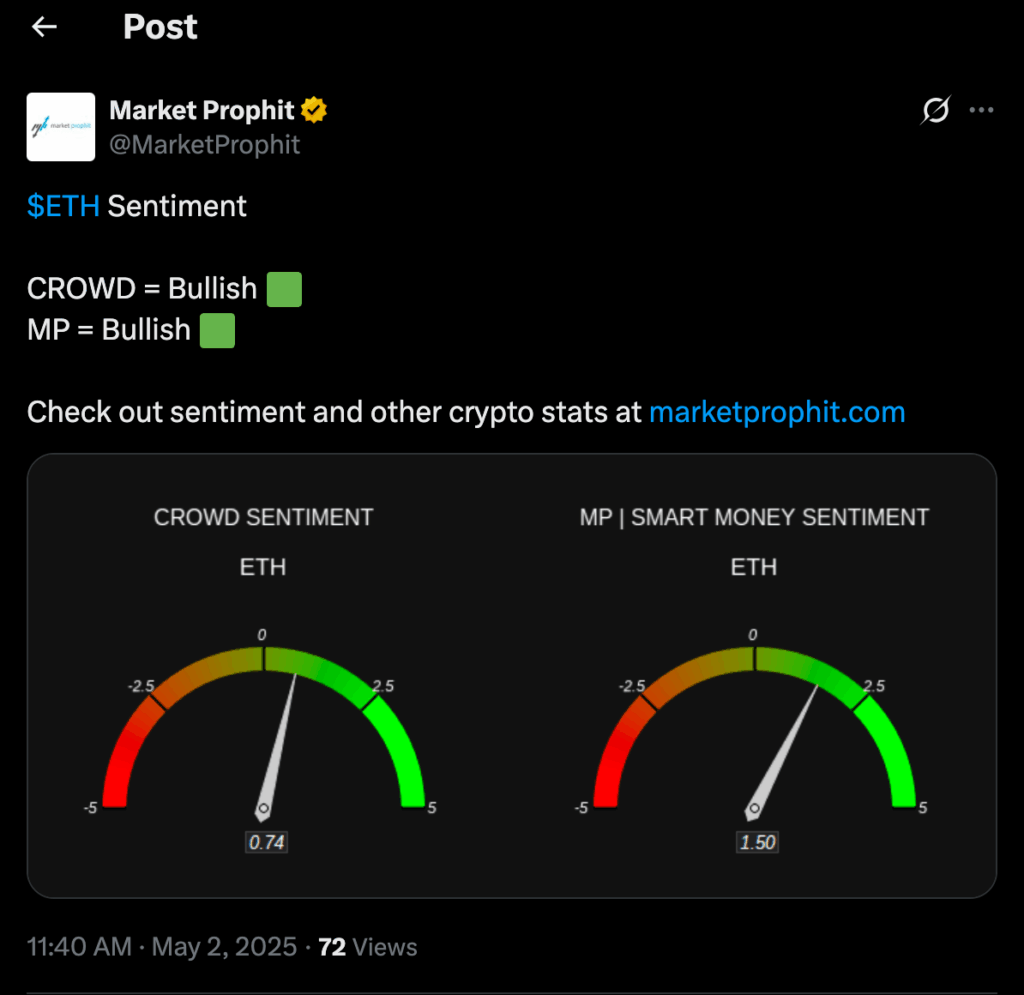
Sentiment indicators are rising, with values at 0.74 and 1.50 in the green zone. This signals broad optimism across various market sectors.
Ethereum Price Holds Steady Near Short-Term Support Levels
The ETH market has sustained a flat price pattern between $1,800 and $1,830 throughout the previous 24 hours. According to CoinMarketCap data, Ethereum price hit an intraday peak of $1,873. Traders then engaged in limited profit-taking, keeping price movements relatively stable.
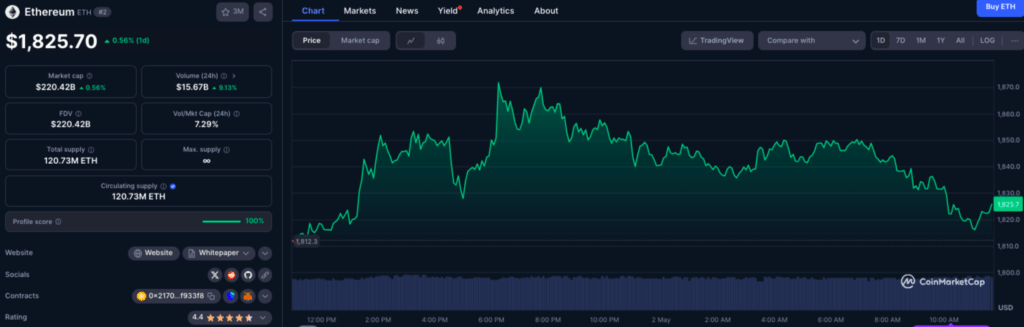
Market participants have shown potent activity based on the volume-to-market cap ratio, which reaches 7.29%. The price attempted to exceed the $1,860 resistance numerous times during the day.
It, however, found support above $1,810 on each correction. The ongoing consolidation phase before direction changes has drawn intense trader attention because it will signal bullish continuation.
Ethereum Price Prediction 2025: ETH on a Reversal from a Falling Wedge
ETH pierced through a falling wedge pattern that appeared on its daily timescale. This generally signifies a bullish price reversal.
Ethereum price action formed a falling wedge pattern from February to early April. This setup then transitioned into a steady uptrend, pushing the price to $1,850.
The market movement gained credibility because trading activity increased alongside decreased transaction pressure. Using the wedge height analysis, the asset demonstrates potential growth toward reaching the $2,800 area.
Ethereum price must surpass the $2,000 level before it can capitalize on its following advantages. This mark maintains a strong psychological and technical resistance stance.
The 21.14 trend strength reading on the Average Directional Index signals an emerging trend. This momentum could strengthen with sustained buying, confirming a bullish outlook.
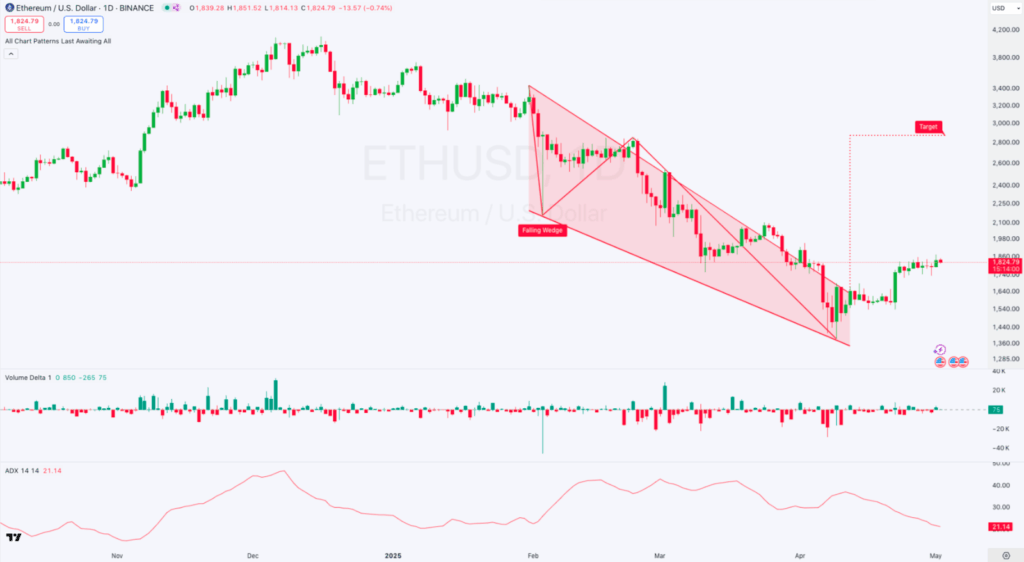
The stabilization of volume delta indicators presents positive signs, while past peak volumes have not yet returned. However, declining negative trends indicate improvement.
Ethereum has established short-term market support at $1,800 above this level. As price action stabilizes, this support becomes a key resistance point.
The nearest resistance level for Ethereum currently spans from $1,850 up to $1,900. Ethereum’s last barrier has to overcome current price rejection in this area to achieve its next testing point at $2,000.
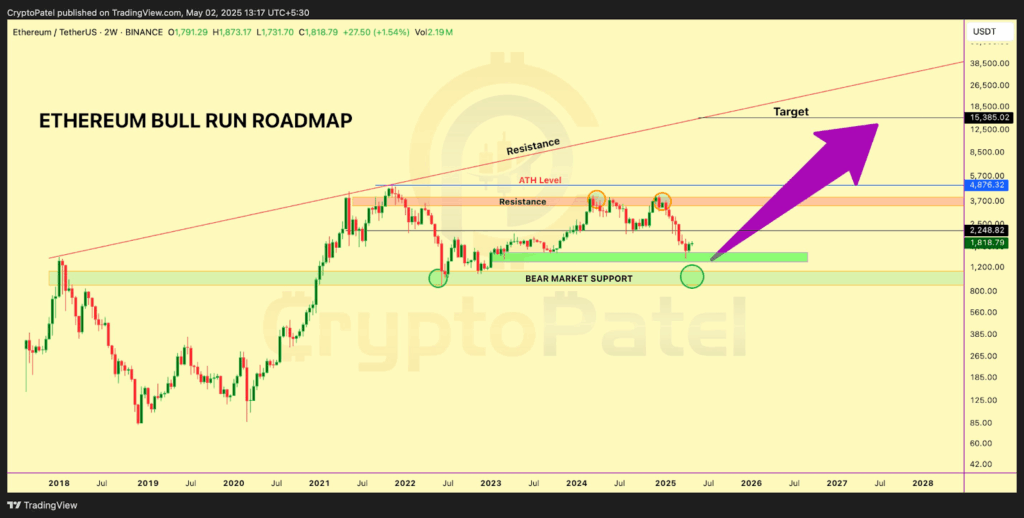
The new resistance at $2,250 belongs to the bull run roadmap and historical weekly charts. Also, it could be targeted if this resistance level gets breached with supporting trading volume.
Technological support exists at $1,79, and another support level at $1,730. These support zones play a crucial role in sustaining the uptrend of the Ethereum price.
Since the price struggles to break past resistance during retracements, maintaining these levels helps reinforce the market structure.
Any breakdown from the current levels can trigger a validation test between $1,250 and $1,790. However, research suggests this scenario is improbable given present market dynamics.
Ethereum must maintain a price level above $2,500 for an extended period. With increased user adoption and enhanced network developments, it could reclaim its peak of $4,876 in 2025.
The forthcoming assessment requires continuous resistance testing through $1,900 until reaching $2,250.