

- FET price breaks resistance, targeting $1.028 in bullish continuation.
- AI token volume doubles as FET gains breakout momentum fast.
- Traders watch the $0.85 zone as new support for entries.
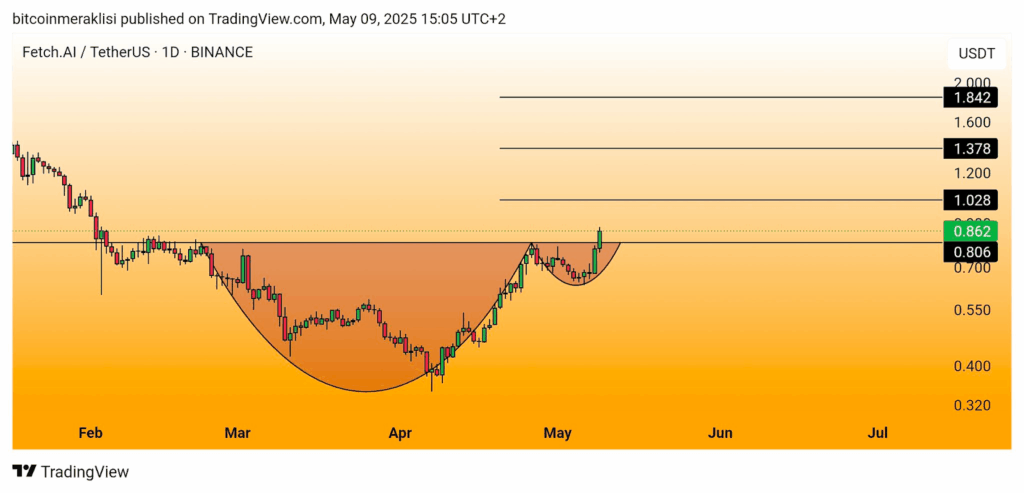
A good technical breakout on the FET Price has followed a breakthrough of a long-term $0.80 resistance barrier. The daily chart confirms the FET price closed above this level with bullish 4-hour candles above the neckline. The pattern exactly, although somewhat unorthodoxly, approximates a textbook cup-and-handle form. This usually indicates continued upward consolidation. The breakout zone of $0.806 is turning into short-term support, showing a new base above the breakout line.
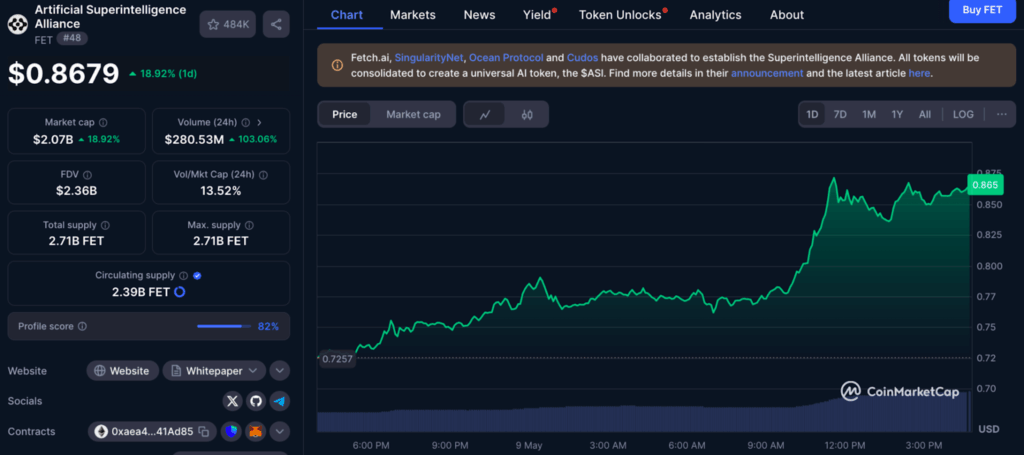
Trading at $0.8679 from $0.7313, FET has grown by 18.92% in 24 hours since May 9, 2025. This is supported by a 103% surge in trading volume to $280.53 million and strong buying leading the way. The momentum surge correlates with the renewed interest in AI-matched tokens, as the feeling around the Artificial Superintelligence Alliance was positive.
The FET Price Technical Levels Suggest Upside Targets at $1.028,$1.378, and $1.842
The most recent technical charts show a bullish price profile which lays out firm upside targets for the FET price action. If momentum is still in motion when overall market forces favor that momentum, the price may test higher resistance levels. The highest at-risk targets are $1.028, $1.378, and $1.842, respectively. These levels are also derived from past resistance areas and Fibonacci extension projections from the cup-and-handle structure depth.
Trading pays special attention to $0.85 – $0.87, which we need to prove this up continuation. A persistent hold would have consolidated any breakout above $0.85. The bulls would then have aimed at testing that $1.00 psychological level. The latest intraday chart displays that FET has a green high above the breakout zone. This is another grass point of $0.885 above the breakout zone, and a swing above the breakout zone, which means willing healthy price action.
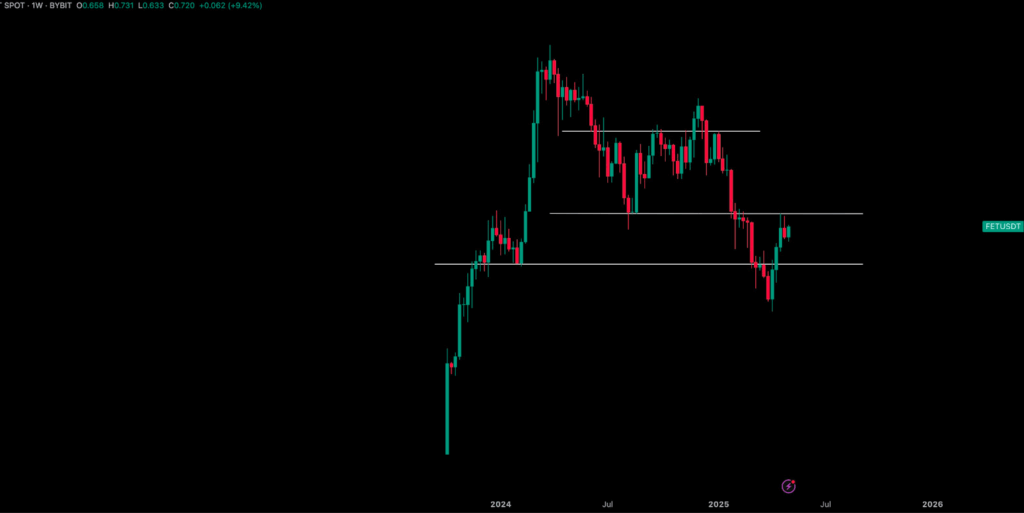
FET has also written a bullish reversal candle above long-term horizontal support in the weekly chart, signaling the start of a medium-term trend shift. Now, the March lows near $0.45 appear to have thrown out a rounded bottom, and the price structure has trended higher incrementally towards the next resistance band.
From CoinMarketCap, as at the time of writing, FET is currently trading on a 13.52% volume-to-market ratio, meaning it has excellent liquidity for its market size. The token is nearing full emission with 2.71 billion and 2.39 billion tokens already in circulation out of a total supply of 2.71 billion. This tight-circulating float further strengthens the currency’s responsiveness when high volumes are at play, as we see now in the current rally.
The FET Price Targets New Entry Above $0.85 as Price Structure Show Strength
The short-term market participants are concentrating on working out a continuation setup around $0.85. The four-hour chart confirms this level as a breakout retest point when the FET price consolidates slightly above it after climbing to $0.885. Should the price keep this level, and provide higher lows on the hourly chart, momentum may build to $1.028 and beyond.
Volume and structure are positive for further upside as long as there are no volatility spillovers in overall crypto markets. A clean four-hour close above $0.87 would put a bearish bias on follow-through candles. The consolidation also shows a lack of selling pressure, as it shows that holders are buying pullbacks and are not selling their positions.
Market observers have emphasized that risk management is as critical as price regulation, particularly with FET trading near short-term overbought levels. However, the fact that it has a defined breakout structure and rising volume dynamics makes the $0.85 – $0.87 zone one of the most watched areas of AI tokens.
The near-term future of the FET price remains constructive, with technical confirmation of the fundamental tailwinds in the artificial intelligence story. With a clear breakout structure, growing liquidity, and roadmap through the Superintelligence Alliance, FET is now coaching amongst more involved altcoins as of early May 2025.