

Key Insights:
- HBAR price kept above the 50% Fibonacci level, supporting continuation of wave 5.
- Historical 69% drawdowns in HBAR price suggest potential for a similar magnitude recovery.
- Analysts confirm reclaimed support at $0.1526 as structurally significant for bullish momentum.
HBAR price continued to be in focus, where analysts gave different technical opinions. From short-term wave projections to long-term fractal patterns and volatility indicators. Analysts pointed out an emerging bullish structure, which was supported by key technical zones.
Additionally, each analyst offered a unique lens on HBAR price positioning. Collectively, these insights build a broader picture of potential movement scenarios for HBAR price in the short to mid-term.
HBAR Price Consolidates Above Key Support Zone
As analyzed by Morecryptoonl, HBAR price was predicting a 5-wave Elliot on the hourly chart. It was also observed that the structure is a part of a wider bullish wave (1) formation with HBAR price hovering at $0.15330 at the time of publishing the analysis.
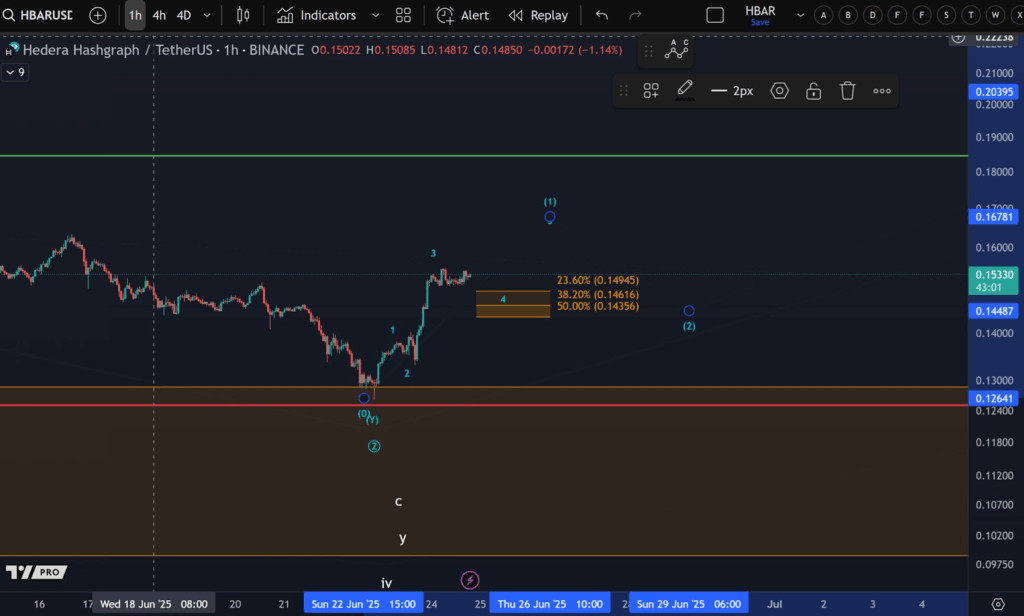
In addition, HBAR price hovered just above a Fibonacci retracement zone marked between $0.14945 and $0.14356. This range represented the 23.60% to 50.00% retracement area for wave 4. A clean pullback into this zone is expected before the potential wave 5 completes the pattern.
Besides, the earlier wave 3 shot up with a starting position of $0.12641. This low was not broken, which proved its relevance as a support base in the structure. In addition, continuous consolidation over the new high indicated the continuation of wave 4.
So long as a bullish forecast holds above $0.14356, a positive trend could be sustained. The chart indicated that HBAR price will grow further in case wave 5 is formed according to the overall bullish structure.
Fractal Repetition Supports Long-Term Bullish Outlook
Analyst EGRAG CRYPTO identified a repeated fractal pattern in the HBAR price on the weekly chart. The chart deemed this as a ‘Move for a Move’ setup, as both 2020 and 2025 have recorded roughly equal -69.7 declines.
HBAR price is sitting atop a significant horizontal assistance level. This zone, which was characterized by the white band, used to be a launchpad for major rallies. Its recent reclaim added technical weight to the bullish thesis.
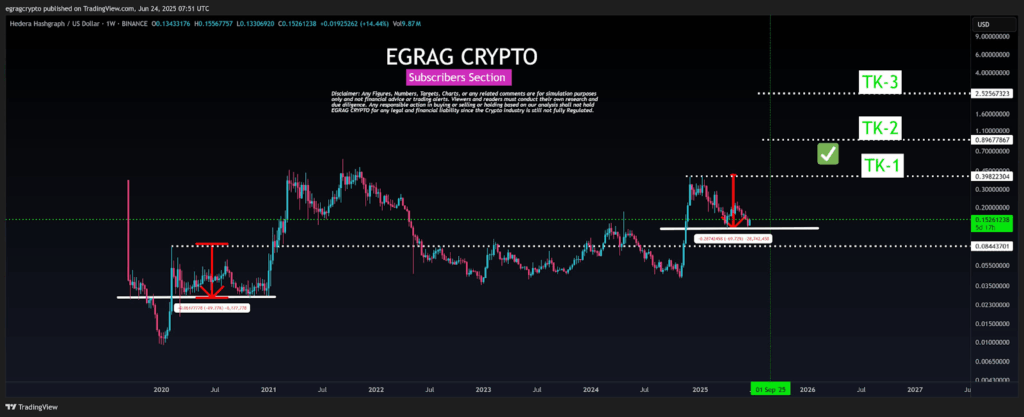
Further, the chart lists three target levels for the next potential breakout. These are TK-1 at $0.3982, TK-2 at $0.8967, and TK-3 at $2.5267. TK-1 was confirmed with a green checkmark, indicating that the first leg of the recovery structure is validated.
A green vertical line pointed to September 1, 2025, suggesting a potential timing marker for the fractal completion. The last major support stands at $0.0844, which is critical to preserve the integrity of the bullish setup for HBAR coin.
Short-Term Pullback Bullish as HBAR Price Holds Support
On the other hand, analysts used Bollinger Bands and the Relative Strength Index (RSI) to assess near-term movement. HBAR price recently jumped to a high of $0.15347 and then retreated slightly due to resistance at the upper Bollinger Band level, around $0.16293.
Additionally, Bollinger Bands have expanded, and the range has augmented in the event of some consolidation. HBAR price is currently contracting to the midline of $0.14465, which more often acts as a dynamic support in an uptrend.
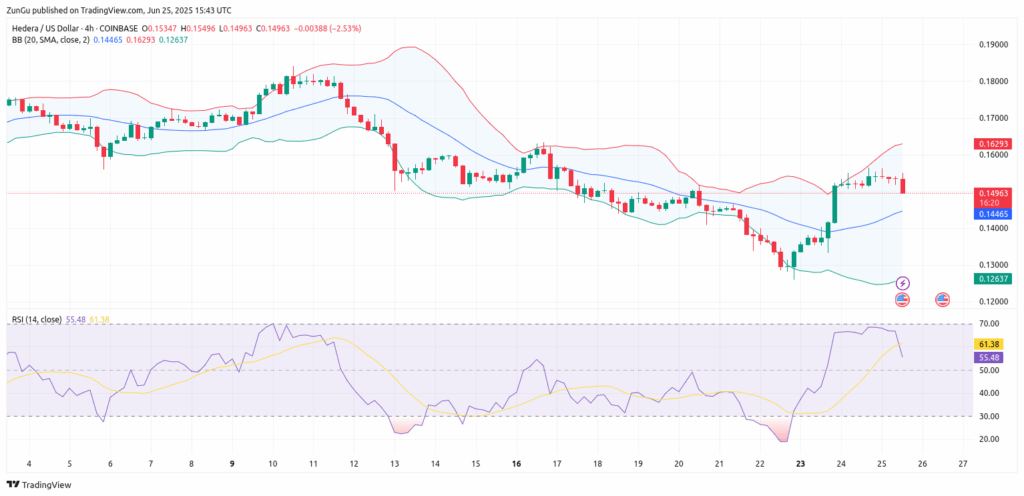
More so, the RSI (14) indicator stood at 55.48, having cooled after touching a recent high of over 61.38. Despite the pullback, it kept above the 50-neutral line, which implied that the retracement is in bullish territory.
A recent bullish candle formed after a rebound from the lower Bollinger Band support at $0.12637. This was accompanied by rising volume and a midline RSI crossover, indicating technical confirmation of a short-term reversal in Hedera price movement.
However, if support holds and momentum resumes, analysts suggest a likely continuation toward $0.3982 and beyond. HBAR price prediction is cautiously optimistic, provided structural levels remain intact and no invalidations occur.