

Key Insights :
- HBAR price prediction 2025 appears bullish as sentiment across the crypto landscape has shifted to the positive side.
- With the recent rally, the Hedera (HBAR) price has formed a bullish pattern of inverted head and shoulders.
- The daily chart indicates that the HBAR price could soon soar by 30%, reaching the $0.265 level in the coming days.
With market sentiment shifting, the HBAR price prediction for 2025 has gained attention. Investors are closely watching where the asset might move in the coming days.
With recent upside momentum, the asset has broken multiple resistance levels. It has finally formed a bullish price action pattern, indicating that HBAR will likely continue its upward momentum in the days ahead.
Current Market Sentiment & HBAR Price Momentum
At press time, HBAR was trading near $0.1996, having recorded a 5% price surge over the past 24 hours. With its bullish outlook and the shift in market sentiment, it has garnered significant attention from traders and investors, resulting in notable participation.
Data from CoinMarketCap reveals that the asset has recorded an 85% surge in trading volume during the same period.
Crypto Expert Views on HBAR
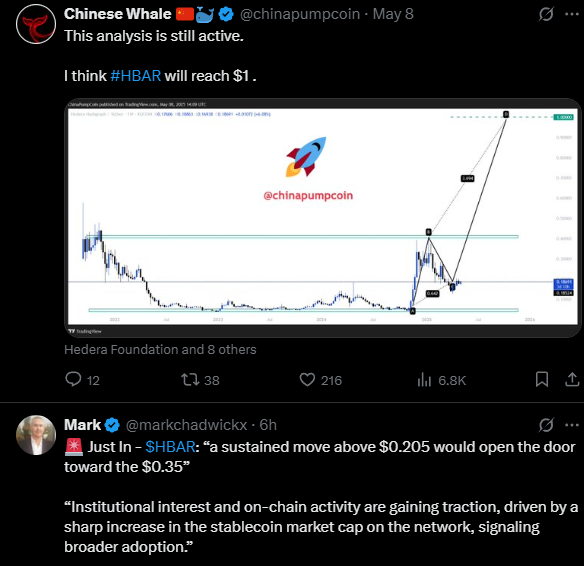
With the shift in market sentiment, crypto enthusiasts have been actively advocating for HBAR — some predicting that the asset will hit $1, while others suggest that if it moves and sustains above $0.205, it could reach the $0.35 level.
This reflects the growing interest and confidence of investors and crypto enthusiasts in HBAR.
HBAR Price Action & Technical Analysis
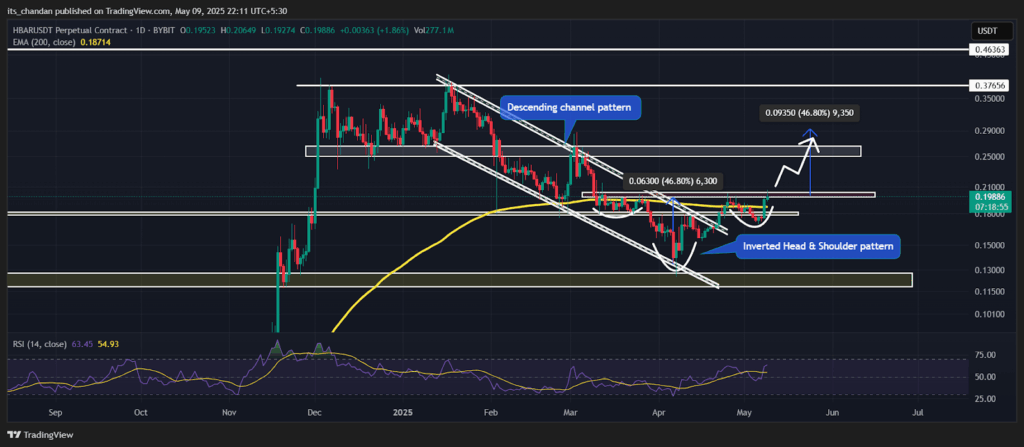
According to expert technical analysis, the HBAR price prediction for 2025 appears bullish and is poised for a massive upside rally. The daily chart reveals that the asset has recently broken out of its prolonged descending channel pattern.
Whereas with the market uncertainty, it successfully retested the breakout area and has now formed a bullish inverted head and shoulders pattern, suggesting it is poised to continue its upward momentum.
HBAR Price Prediction 2025
Based on recent price action and historical patterns, if the HBAR price successfully breaches the inverted head and shoulders pattern and closes a daily candle above the $0.2075 level, it could activate a bullish HBAR price prediction 2025.
The price may then see an upside rally of 30% until it reaches the next resistance level at $0.2667.
The HBAR price prediction 2025 could only maintain its upward momentum if it breaches the neckline of the bullish pattern and closes daily candles above the $0.207 mark; otherwise, it may fail.
With the recent upside momentum, the asset has successfully moved above the 200 Exponential Moving Average (EMA) on the daily time frame, confirming a shift into an uptrend.
Meanwhile, its Relative Strength Index (RSI) remains below the overbought zone, currently standing at 62, indicating that the asset still has room to continue its upward momentum.
Bearish On-Chain Metrics
Despite the bullish sentiment across the market and the formation of bullish price action, investors and traders appear to be leaning toward the bearish side.
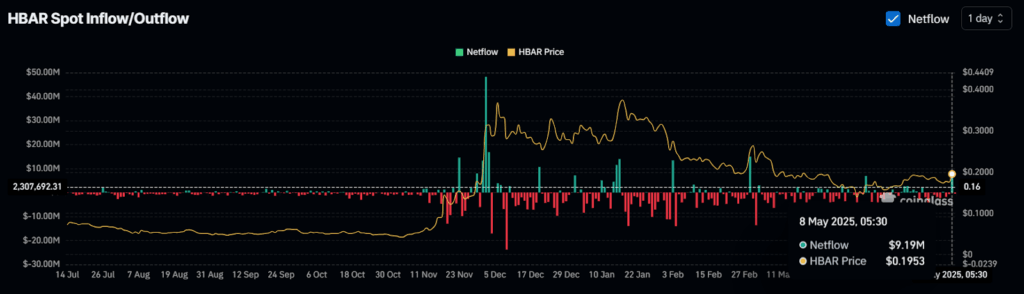
$8.75 Million Worth of HBAR Inflow
Data from spot inflow/outflow reveals that exchanges have witnessed an inflow of over $8.75 million worth of HBAR coins over the past 48 hours. This substantial inflow amid a trending market is seen as a sign of selling pressure and may trigger panic selling in the asset.
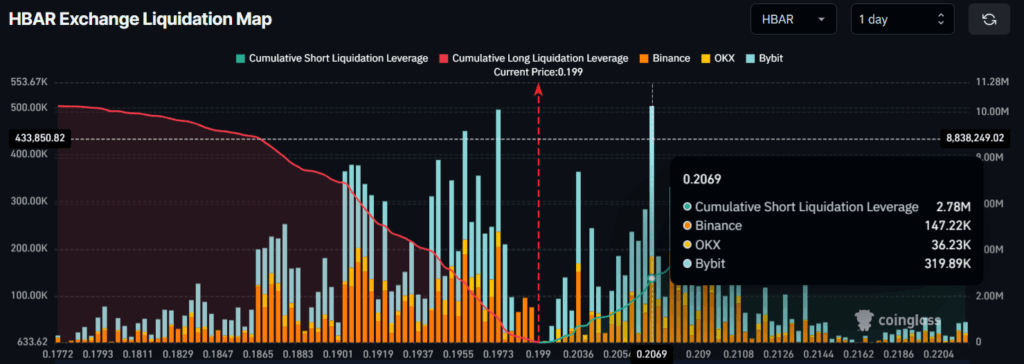
$2.80 Million Worth of Bearish Bets
At the same time, intraday traders seem to be strongly betting on the bearish side. Data shows that traders are over-leveraged at $0.197 on the lower side, where they have built $1.04 million worth of long positions, and at $0.2069 on the upper side, where they have built $2.78 million worth of long positions.
These bets by traders and exchange inflows clearly indicate that bears are currently dominating, and there is also a possibility that the asset could experience a price correction before a major rally begins.