

Key Insights:
- The HBAR price prediction suggests that the asset could crash by 30% if it closes a daily candle below $0.177.
- Traders are over-leveraged at $0.1844 and $0.1949, with $1.70 million worth of long positions and $2 million worth of short positions.
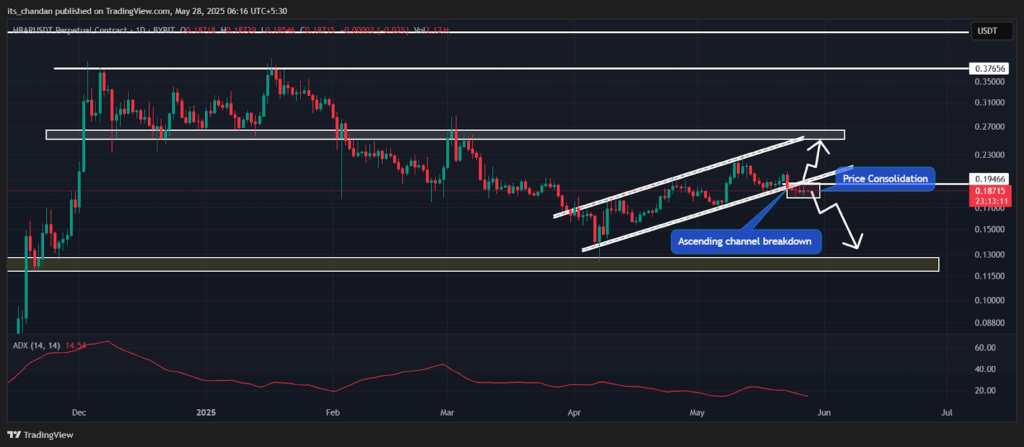
Amidst market uncertainty, the HBAR price prediction on a broader time frame appears bearish, as the token fails to maintain its uptrend. The daily chart reveals that the prolonged uptrend may have ended and could continue with downside momentum and selling pressure in the days ahead.
Bearish On-Chain Metrics Confirm Sentiment
So far, traders and investors have been following the same bearish view. Some have been dumping their holdings, while others are betting on the bearish side, as reported by the on-chain analytics firm Coinglass.
HBAR Inflows into Exchanges
Data from spot inflow/outflow revealed that exchanges across the crypto landscape have recorded continuous inflows over the past two days, amounting to a total of 171K HBAR tokens.
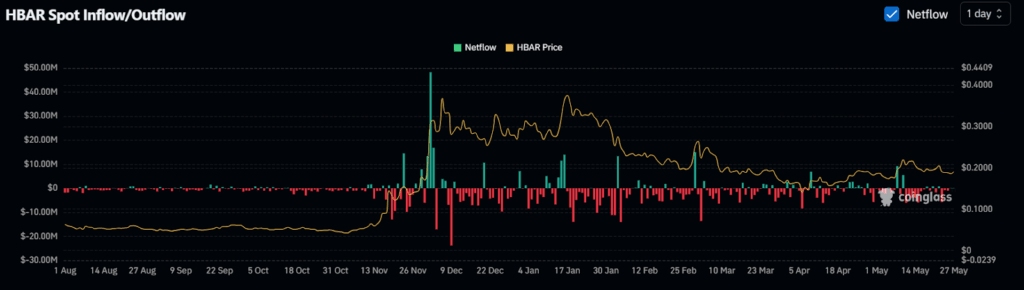
This modest inflow indicates that investors and long-term holders may be done holding their tokens. Typically, such inflows are a sign of selling pressure, which often leads to a price decline.
$2 Million in Bearish Bets Reflect Over-Leveraged Traders
Meanwhile, traders also appear to be following the current price action. They are currently over-leveraged at $0.1844 on the lower side (support) and $0.1949 on the upper side (resistance).
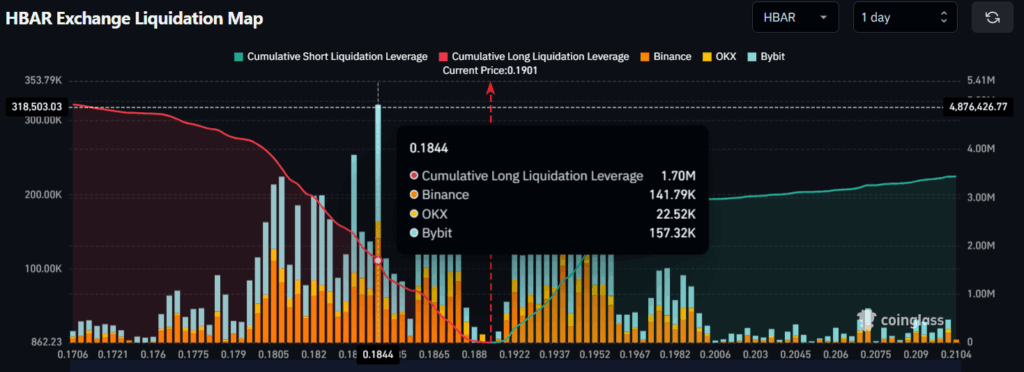
At these levels, they have built $1.70 million worth of long positions and $2 million worth of short positions. This overleveraged positioning reflects traders’ bearish outlook and a strong belief that the asset is unlikely to surpass the $0.1949 level anytime soon.
Current Price Momentum
At press time, HBAR was trading near $0.19 and had recorded a modest price surge of 2.75% in the past 24 hours. During the same period, its trading volume increased by 20%, indicating heightened participation from traders and investors compared to previous days.
Technical Analysis: Signs Point to Further Decline
According to expert technical analysis, the HBAR price prediction appears bearish, as it has recently broken down from a prolonged ascending channel pattern and is poised for a potential price crash.
The daily chart reveals that the asset has been consolidating in a tight range following the recent breakdown, which appears to be preparation for a massive sell-off.
HBAR Price Prediction
Based on the recent price action and historical patterns, if the downside momentum continues and the asset breaches this consolidation, the HBAR price prediction suggests that it could see a price decline of over 30% until it finds the next support at the $0.12 level.
On the other hand, if the momentum shifts and the asset begins to rally, closing a daily candle above $0.1985, the HBAR price prediction suggests that it could soar by 29% until it reaches the resistance level of $0.256 in the future.
Weak Trend Signals from ADX
Following the breakdown and ongoing consolidation, HBAR’s Average Directional Index (ADX) stands at 14.54, indicating a weak trend and low directional strength in the current price movement.
This suggests that the asset is likely to remain range-bound unless a significant catalyst triggers a breakout or breakdown. Traders may want to wait for a stronger ADX reading above 20 before confirming any trend reversal or continuation.
Despite its bearish outlook, HBAR is gaining widespread attention from crypto enthusiasts. Recently, a well-followed expert shared a post on X, stating that Bitcoin is no longer worth it and further noted that altcoins like HBAR are hidden gems instead.