

 is showing signs of a technical recovery after a multi-month decline. Market analysts and crypto traders are)
Key Insights:
- Hedera is testing a falling wedge breakout near $0.160 after holding strong support at $0.150.
- Futures volume surged 89%, but open interest dropped, signaling liquidation-driven volatility.
- Binance traders show a 1.58 long/short ratio, reflecting rising bullish sentiment on HBAR.
Hedera (HBAR) is showing signs of a technical recovery after a multi-month decline. Market analysts and crypto traders are watching closely to see if HBAR can sustain its recent upward moves and reach $2 before the end of 2025.
Although HBAR is currently trading around $0.156, technical chart patterns, volume trends, and market sentiment are suggesting that a potential trend reversal may be forming. Key price levels and derivatives data will play a role in determining HBAR’s path forward.
Market Sentiment Mixed but Turning Cautiously Bullish on Hedera
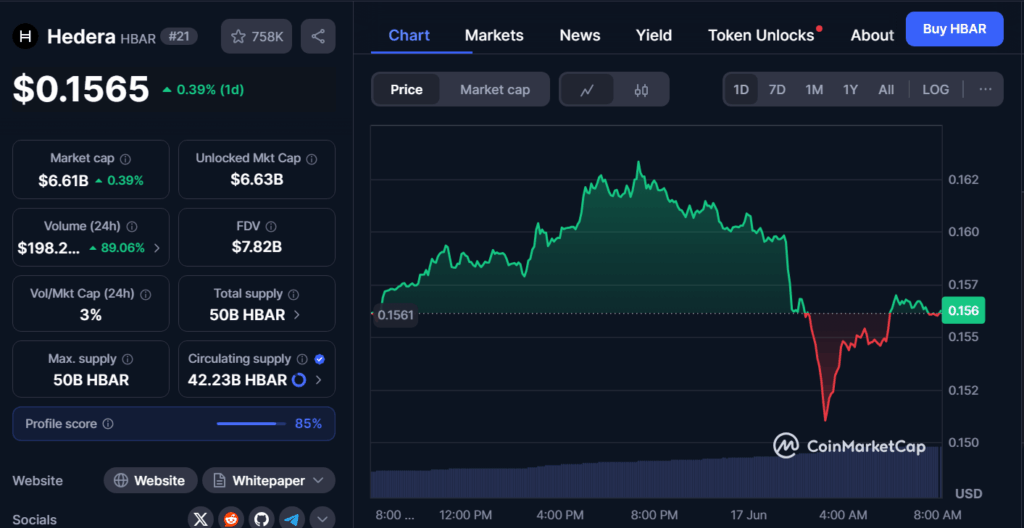
Hedera is trading at $0.1565, showing a 0.39% intraday gain after recovering from a sharp drop to $0.150 and peaking at $0.162. The price action formed a clear V-shaped recovery, indicating strong buyer interest near key support.
Trading volume surged 89% to $198.2 million, pointing to renewed market participation possibly linked to token unlock activity or speculative interest.
The support range between $0.150 and $0.152 has held firm despite high volatility. Resistance is now seen at $0.160 and $0.162.
A breakout above $0.162 could shift momentum further in favor of the bulls. Market sentiment is cautiously optimistic. Binance data shows a long/short ratio of 1.58, meaning more traders expect the price to rise.
Top traders on Binance are slowly increasing long exposure, reflecting growing but measured confidence. This comes as global positioning data remains balanced.
The fully diluted valuation of $7.82 billion versus a $6.61 billion market cap shows room for more tokens to enter circulation, adding some pressure.
If $0.150 continues to hold, attention will likely shift to testing $0.160 and pushing beyond $0.162 in the short term.
Hedera HBAR Derivatives Data Analysis
Derivatives metrics give further insight into HBAR’s short-term positioning. Over the past 24 hours, futures volume jumped to $312 million, up nearly 90%.
However, open interest declined slightly to $233 million, showing that recent price activity may have been driven by position closures, not new trades.
This setup often points to liquidations and stop-loss triggers. Liquidation data confirms this. In the last 24 hours, over $850,000 in long positions were liquidated as HBAR dropped from $0.162 to $0.150.
However, recent hours saw short positions being liquidated, which may indicate that the downward pressure is fading and buyers are regaining control.
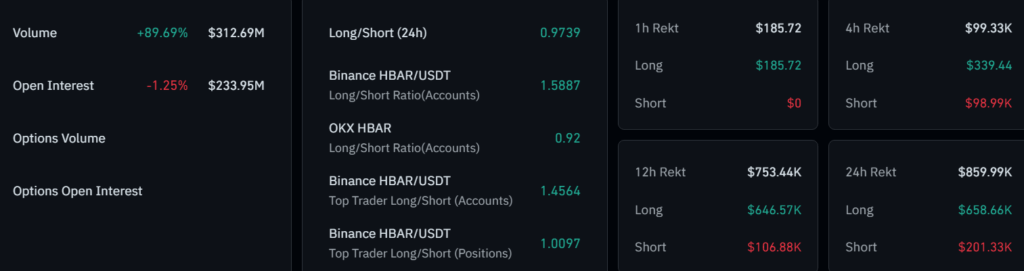
Long/short account ratios for top traders are slightly bullish. On Binance, top trader long positions outnumber short ones, and the ratio by account count stands at 1.45.
However, the position size ratio is closer to 1.0, meaning traders are staying cautious while still favoring the upside.
If open interest begins to rise again, especially with long positioning, this would provide stronger confirmation that traders are regaining confidence in a bullish move.
HBAR Technical Setup Indicates Possible Reversal
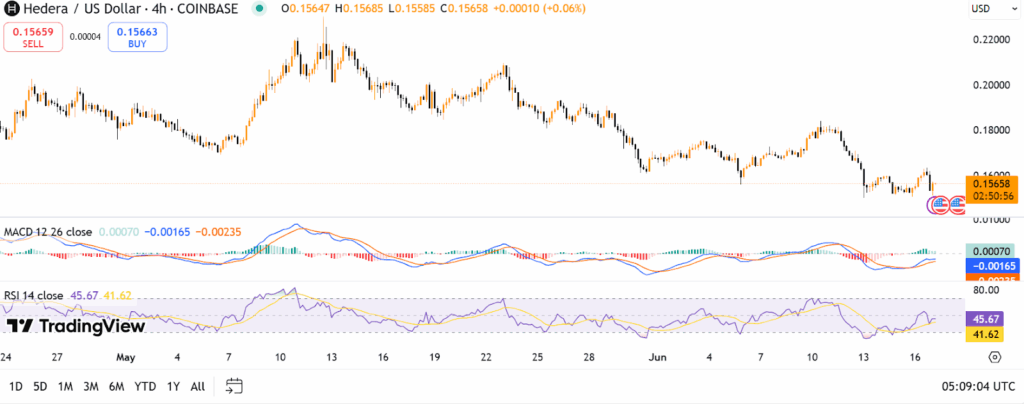
HBAR is experiencing chances of a current trend reversal as it remains in a falling wedge configuration in the 2-day charts.
Two down-sloping trend lines, which form this structure, usually indicate a bullish breakout once the price is able to close above the upper line or resistance.
Since early 2025, the price has been fluctuating between $0.130 and $0.160, with numerous lower support range tests.
Buyers have always jumped on board just about at the area of $0.130, and this point has been established as reliable in terms of relative demand.
In the current scenario, Hedera is experimenting with the upper wedge around the price range of 0.160. It has been serving as direct resistance, and the recent price attempts to close below it.
A breakout above $0.162 on heavy volume would be a bullish change and might see the price rise to the level of $0.240.
The RSI is moving out of oversold zones, which is encouraging the concept of a restoration of momentum.
However, HBAR should move above the $0.240 mark. The following levels to consider are $0.350 and $0.400. Large-scale market support and investor demand would be needed to reach $2 by the year 2025.