

Highlights:
- JASMY price surged 130% from its support zone and now eyes $0.059 as the next key level.
- A breakout from a broadening wedge could push JasmyCoin to $1.80 long-term.
- On-chain activity and rising volume support sustained bullish sentiment for JASMY.
JasmyCoin (JASMY) is drawing significant attention across the crypto community as bullish sentiment grows around its recent price action.
After rebounding sharply from historical support zones, JASMY price has posted impressive gains, reigniting discussions of a long-term breakout.
Analysts suggest the token could reach $0.059 in the short term, with extended projections targeting the $1.80 level.
Bullish Rebound Sets Stage for Uptrend
Over the past week, JASMY has climbed more than 130%, rebounding from the $0.012–$0.014 support range. This zone has historically served as a demand region, forming the base for past rallies.
According to Solberg Invest, the recent bounce is a signal that accumulation is underway, and a new bullish wave may be forming.
The chart shared in his analysis pointed to a clear macro reversal pattern, with the next target zone lying near $0.028 to $0.032.
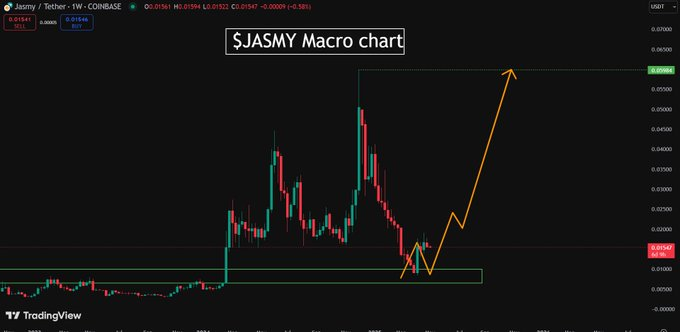
If the current trend sustains, the token could hit $0.059 in the coming weeks. This move would mirror JASMY’s previous upward thrusts during 2021–2022 when price action surged after long consolidation phases.
Volume has begun to build again, supporting the idea that this breakout is being driven by more than short-term speculation.
JASMY Price Prediction from Wedge Structure
A more ambitious outlook has been shared by Javon Marks, who posted a technical breakdown highlighting a broadening wedge pattern.
This pattern, stretching over multiple months, signals increasing volatility and typically precedes large bullish moves.
Marks suggested that a breakout from this wedge could deliver over 440% in gains, sending JASMY price toward the $0.059 level in the near term.
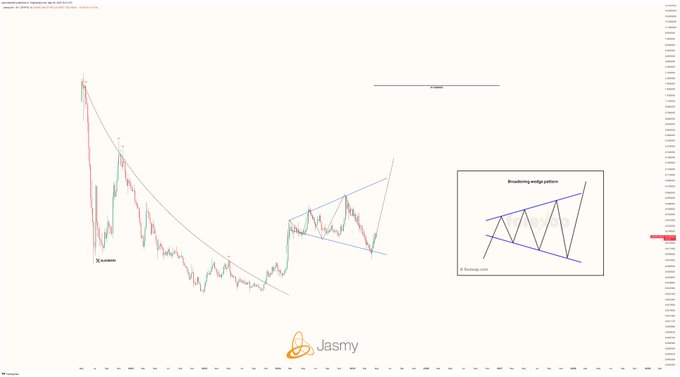
However, the broader structure of the wedge suggests even greater potential. If JASMY completes a full move beyond the breakout and follows historical wedge projections, it could revisit highs near $1.80.
Marks emphasized that this would require sustained buying pressure and confirmation of volume support. However, he noted that the current setup is among the most favorable he saw for JasmyCoin in recent quarters.
Technical Indicators Support Bullish Thesis
On the technical side, momentum indicators offer additional validation. The weekly Relative Strength Index (RSI) is trending upward but remains below overbought territory, suggesting there is room for more upside before the rally overheats.
The Moving Average Convergence Divergence (MACD) histogram is also turning positive, a sign that momentum is shifting in favor of bulls.
Volume has doubled in the past five days, according to CoinMarketCap, and Coinglass derivatives data shows open interest rising steadily.
This suggests increasing trader engagement and the possibility of leveraged long positions building across exchanges. These technical metrics reflect a shift in sentiment, with bulls now regaining control.
Supporting this momentum are on-chain signals of accumulation. The number of wallets holding over 100,000 JASMY tokens has grown consistently since early April.
This uptick in mid-sized holders typically signals growing confidence among retail and semi-institutional investors.
Exchange outflows have also increased, indicating buyers are moving JASMY to cold storage rather than preparing for immediate selling. Such behavior often aligns with bullish conviction and long-term positioning.
Key Resistance Levels and Final Targets
In the short term, traders are watching for a break above $0.032 and $0.045. A successful breach would open the path to $0.059, a target reinforced by both Solberg’s macro chart and the wedge pattern’s first breakout leg. Beyond that, Fibonacci levels point to $0.088 and $0.12 as the next hurdles.
If other macro conditions and volume remain favorable in the long run, JASMY price can have an upward trend that is believed to extend to $0.20 in the long run.
This target of $1.80 is quite achievable based on chart pattern analysis that seeks to play out patterns that have been achieved in the past by altcoins.