

Key Insights:
- Pi coin price saw a sharp one-hour drop on June 12, triggered by a $23M volume spike, losing over a third of its value.
- Pi coin price remains below key moving averages, reflecting persistent bearish pressure after the dump.
- Tight consolidation signals indecision, with breakout potential in either direction.
Pi coin market has seen an increase in volatility in various timeframes, and analysts point to sudden sell-offs, resistance rejection, and declining momentum signs. The present Pi price formation is overrun with a mixture of high-volume breakdowns, shrinking consolidation zones, and oversold levels, which collectively indicate the inability to absorb selling pressure and lack the upward recovery momentum.
Pi Coin Price Abrupt Breakdown
According to technical analyst RAYS UNITED, Pi coin’s 1-hour chart exhibited an extraordinary and abrupt decline. Within the period, Pi coin dropped from approximately $0.64 to a session low of $0.40 within a single hourly candle.
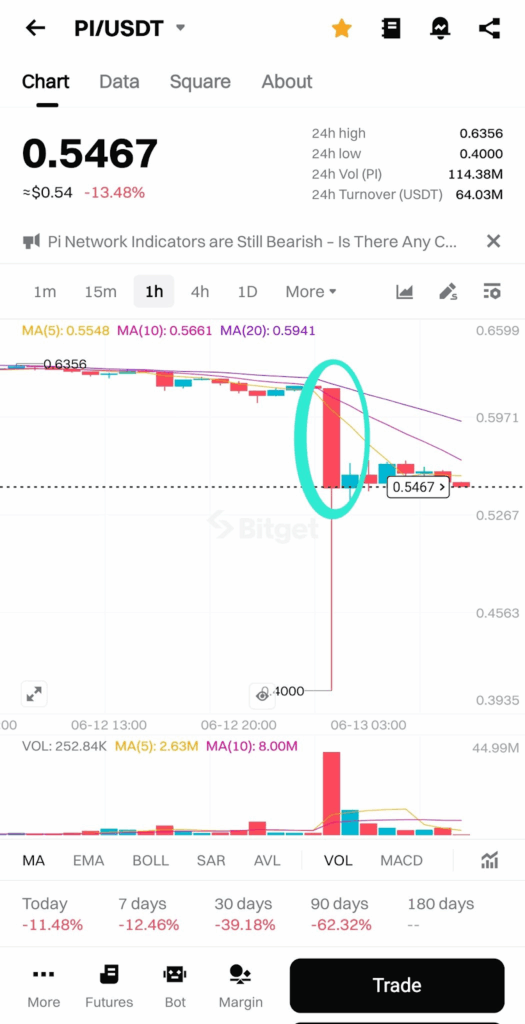
Consequently, the dip translated to a loss of approximately 37.5% in Pi coin within an hour, with an immensely high volume bar. This sell-off was massive, valued at an estimated $23 million in PI tokens, and multiples higher than short-term volume averages, with the MA(5) and MA(10) at 2.63 million and 8.00 million, respectively.
Additionally, this rapid drop disrupted the previously established consolidation zone near $0.6356, which had functioned as temporary resistance in the preceding sessions. While the dump unfolded, Pi price cut below several short-term moving averages.
More so, the steepened trajectory of these moving averages confirms a momentum shift, with the price unable to reclaim higher levels in the immediate aftermath. Pi coin price failure to re-establish support above $0.59 has kept sentiment bearish, leaving Pi coin exposed to further downside if buyer interest remains subdued.
Key Resistance Levels Block Pi Coin Recovery
Analyst TheDeFiAngel pointed out that small bodies and low volume characterized the most recent daily candles, showing that the market is not fully participating and traders are indecisive. Pi coin price has tested many times the level of $0.6563 as a major short-term resistance. The continued inability to surpass the highs of June 3 signals weakening buyer conviction and strengthens the case for bearish continuation unless upward momentum increases.
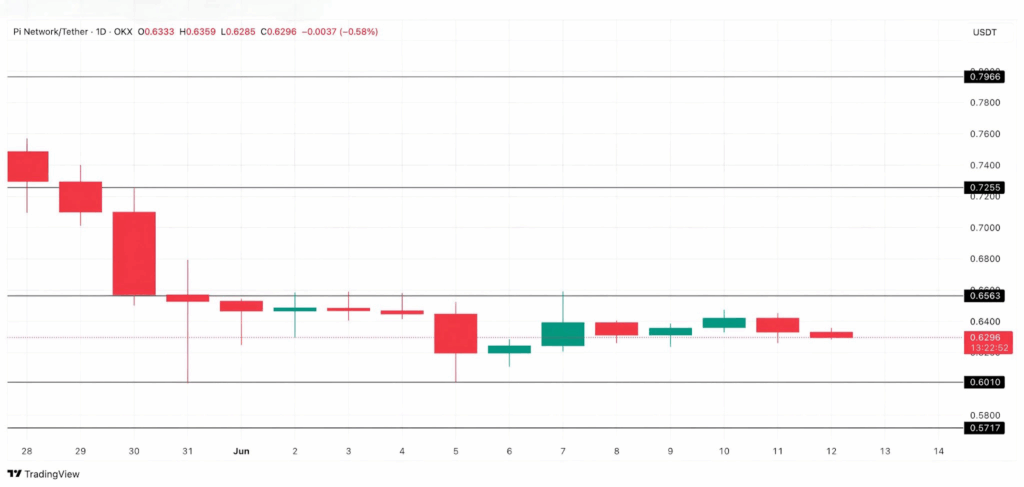
Further, the analyst noted that Pi coin remains below its former support levels of $0.7255 and $0.7966, which now function as formidable overhead resistance. The persistent rejection from the $0.64 zone, combined with tightening Pi price action, raises the risk of a breakdown below the $0.6010 support.
Pi Coin Struggles to Recover as Oversold Signals Persist
In addition, on the 4-hour timeframe, recent price activity presents a sharp liquidity event followed by a modest recovery. Accordingly, the analyst noted that Pi coin price dipped to $0.40 then bounced back to $0.55604. Though the price recovered, it did not manage to revisit the range before the drop and stayed below the $0.60 mark.
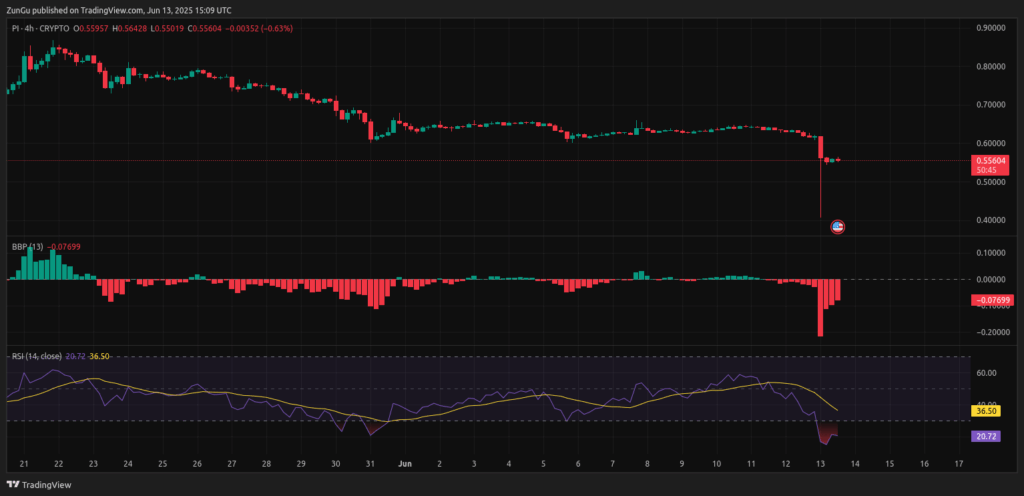
The Bollinger Band Percent B (BBP) oscillator verifies the anomaly of the occurrence. With Pi coin price considerably below the lower Bollinger Band, it is pointing to a selloff that is beyond the usual volatility levels. Despite the subsequent slight increase, BBP remained negative, which supports further downside risk and indicates that Pi coin price has not returned to normalcy.
At the same time, the Relative Strength Index (RSI) hit an extreme oversold level of 20.72 and then returned to 36.50. This short-term RSI recovery has not been powerful enough to break the 40-45 area, which is normally needed to indicate a bullish reversal.
Moreover, the lower location of the RSI below the signal line and the centerline (50) indicated the bigger picture of the bearish opinion. As long as Pi coin price fails to retake the $0.60 resistance and oscillator strength does not pick up, Pi coin is vulnerable to a fresh wave of selling pressure, which may retest sub-$0.50 support areas.