

Key Insights:
- If Polkadot breaks out of the falling wedge pattern, it could rise past $4.78. However, a drop below the trendline may send it down to $3.20.
- The Crypto Professor predicted a possible 19.97% increase from Polkadot’s present shape.
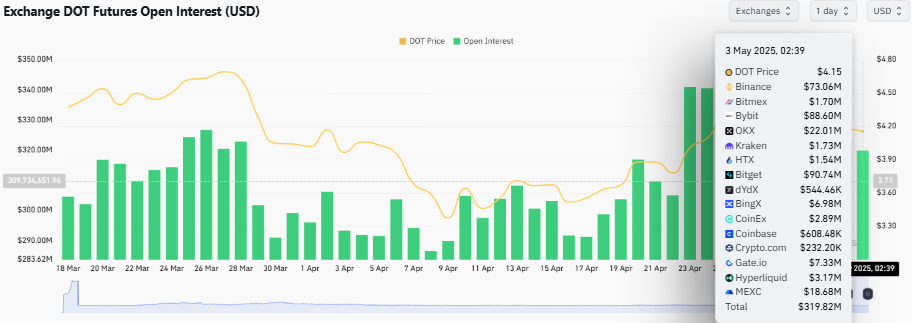
- The open interest value for DOT futures reached $319.82M as DOT traded at $4.15.
Polkadot price has formed a short-term price pattern, and its breakout could shape its next move. With open interest rising, traders are watching closely for direction.
Polkadot Price Prediction
On the 4-hour chart, DOT formed a downward pattern inside an upward trendline. It signaled impending bullishness.
At press time, Polkadot price was trading at $4.15, slightly above the trendline support. However, it is expected to face resistance near $4.40 at the upper falling wedge pattern.
A breakout from the wedge pattern could spark an upward wave for DOT. This could push the price to $4.78, where two previous high points were recorded.
The MACD indicator showed early bullish signals as the MACD line moved above the signal line. Histogram bars also pointed to a potential upward price movement.
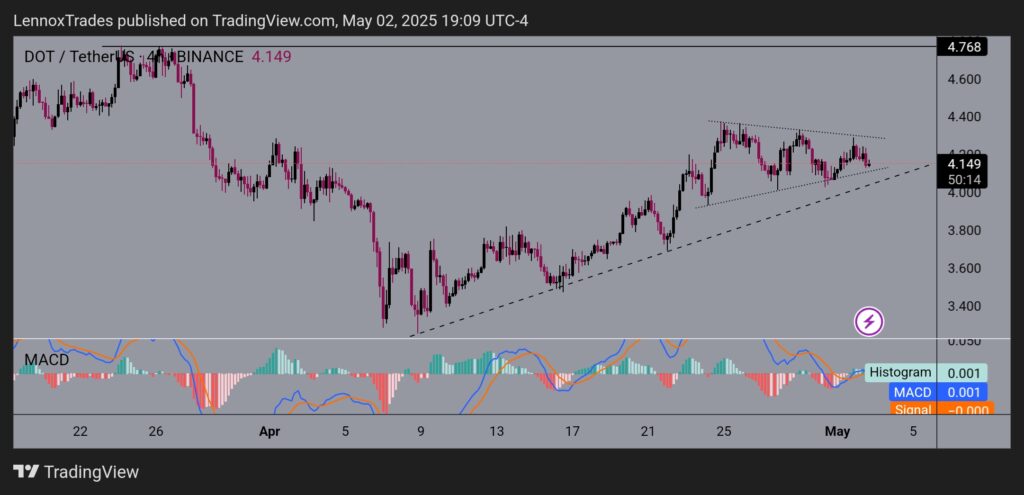
The maintenance of support at $4.00 for the ascending trendline defined the direction of momentum between bullish and bearish outcomes.
A Polkadot price drop underneath the rising support at $4.00 would indicate a market move toward $3.60. At the same time, very bearish circumstances could push the price toward $3.20 support.
The next market direction would become clear through an outcome. This would show the importance of the levels $4.00 and $4.40 for short-term price changes.
Polkadot Price Analysis: Bullish Breakout and Key Levels
DOT token exceeded a downward trend by surpassing its previous limit after maintaining $3.97 as its vital support mark. The Crypto Professor noted that Polkadot is forming a bullish rectangle pattern. He predicted a potential 19.97% price increase from its current shape.
Polkadot price reached $4.20 when it exceeded vital resistance levels, thus validating an ongoing upward trend. This breakout signaled a change from the ongoing market pressure since it created a stable support base where trends may continue.
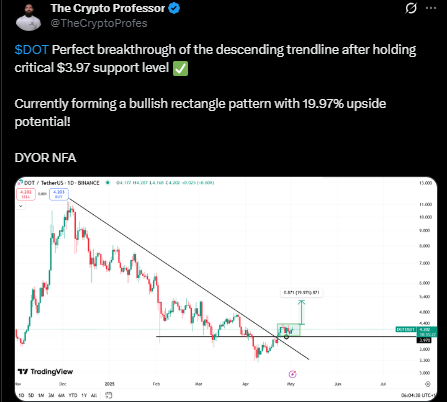
DOT tended to shift toward $5.05 after breaking through the boundaries of a rectangle pattern. A failed breakout could allow DOT to drop below $4.00 and bring back negative market sentiment.
Observing market activity while checking for strong follow-through was key to indicating a confirmation. The near-future DOT analysis showed constructive signs, which investors can find pattern validation and support at current levels.
However, they note that they should still perform independent market research and control risk exposure.
DOT’s Open Interest
The open interest (OI) value for DOT futures reached $319.82M as the Polkadot price traded at $4.15. Bitget took the lead position with $90.74M, Bybit followed with $88.60M, then Binance came third with $73.06M.
DOT open interest steadily declined from late March to mid-April. The price trend followed this drop, signaling fewer speculative bets and weakening bullish sentiment.
The open interest grew between mid-April and DOT’s price recovery, which surpassed $3.60 to reach more than $4.10. This indicated ongoing interest from traders who re-entered positions after periods of lower activity.
The recent highs were connected with a rapidly growing number of traders in positions that signaled a heightened risk of market volatility. A capability destiny price increase for DOT could generate short squeezes that rally the token cost further.
Alternatively, a drop that shifted sentiment negatively would lead to the liquidation of highly leveraged positions, escalating market falls.
A rising trend in OI and price values indicated a positive market trend. However, unexpected shifts in funding sources or sentiment could reverse this direction.