

Key Insights:
- Polkadot price prediction for the coming days suggests a potential 10% decline.
- DOT has recently broken below two major support levels — a descending trendline and a horizontal support.
- Despite the bearish market sentiment and price action, 77% of DOT traders on Binance are positioned on the long side.
Amid market uncertainty, Polkadot (DOT) has been struggling in recent weeks and has now become a hot topic of discussion. With DOT facing resistance at a key level, the chart is flashing a bearish signal, indicating that the price could soon experience downward momentum.
Polkadot (DOT) Price Action & Technical Analysis
At press time, DOT was trading near $3.90, having recorded a price decline of over 1.55% in the past 24 hours. Amid the bearish outlook, trader and investor participation has plummeted.
Data from CoinMarketCap reveals that DOT’s trading volume during the same period dropped by 13%, suggesting weak strength behind the asset’s downward momentum.
This downside momentum and bearish outlook for DOT come at a time when major assets like Bitcoin (BTC) and Ethereum (ETH) are holding decent gains.
According to expert technical analysis, the Polkadot price prediction for the coming days appears bearish, as it has formed a strong bearish price action on the daily time frame.
The daily chart shows that the asset has witnessed a strong price reversal near $4. This level appears to be an area of strong selling pressure, where sellers have consistently prevented DOT from breaking above.
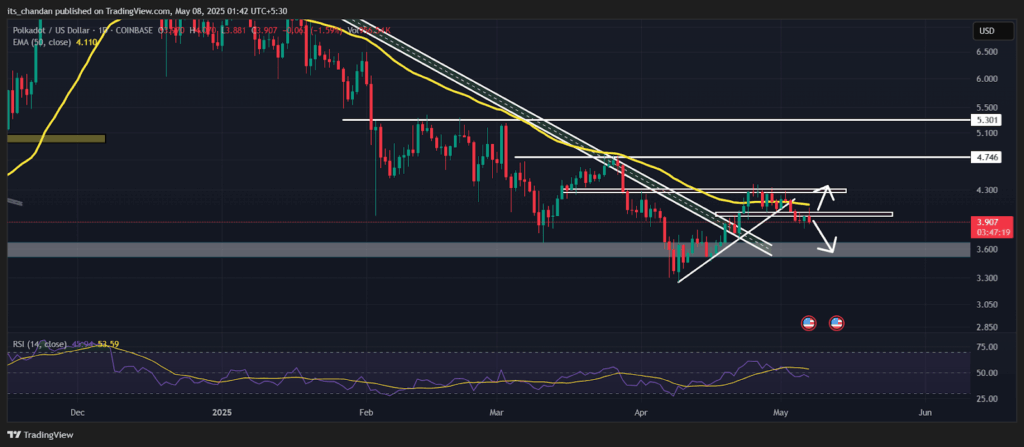
Over the past few days, DOT has tested this resistance level multiple times but failed to breach it and is now forming a strong bearish candle.
Polkadot Price Prediction
Based on recent price action and current patterns, if DOT remains below the $4.05 level, the Polkadot price prediction turns bearish, and the asset could see a 10% downside move.
However, the outlook could turn bullish only if DOT breaks above the $4 resistance level and closes a daily candle above it. If this happens, the asset could see a modest surge of 7%, potentially reaching the $4.40 level.
With the ongoing price struggle, DOT’s Relative Strength Index (RSI) remains near 44, which is considered neutral territory, neither in the overbought nor oversold zone.
An RSI around 44 typically suggests market uncertainty, with the asset’s momentum leaning towards the bearish side.
DOT has also faced resistance at the 50-day Exponential Moving Average (EMA), indicating a potential shift in momentum and the possibility of further downside if it fails to reclaim this level soon.
Bullish On-Chain Metric
Despite the bearish price action, it appears that investors and traders have been strongly accumulating and betting on the bullish side, as reported by the on-chain analytics firm CoinGlass.
Data from spot inflow/outflow reveals that exchanges across the crypto landscape have witnessed an outflow of $810k worth of DOT tokens over the past 24 hours.
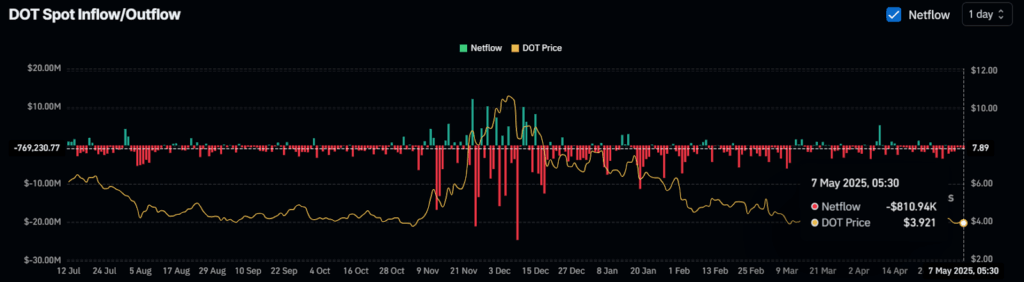
This notable outflow of assets from exchanges suggests potential accumulation by long-term holders, which could lead to buying pressure and further upside momentum.
$9.65 Million Worth of Bullish Bet
At the same time, traders are strongly betting on the bullish side. Data shows that traders are over-leveraged at $3.82 on the lower side and $4.08 on the upper side.
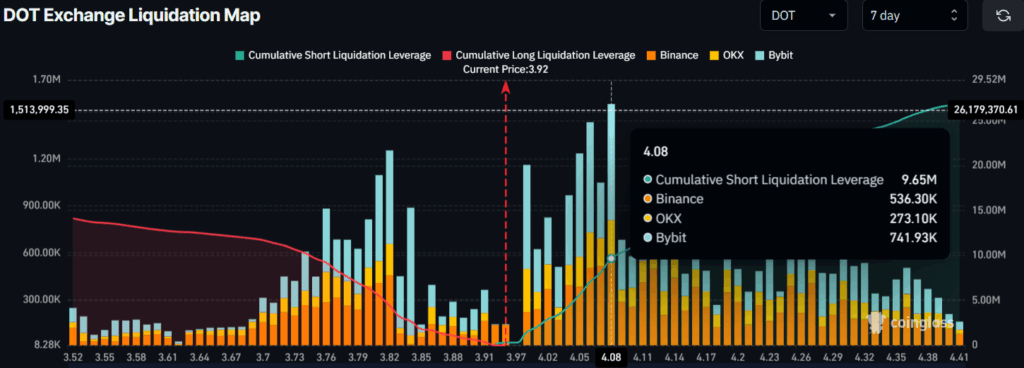
At these levels, bulls have built $4.39 Million worth of long positions, while bears have built $9.65 Million worth of short positions, clearly indicating that bears are dominating the asset and appear to be pushing DOT’s price to lower levels.