

Key Insights:
- XLM price rose to $0.2378 despite a 12.38% weekly drop, signaling a rebound in interest.
- Analysts point to a falling wedge and MACD divergence, forecasting a $0.50 target.
- The $0.209–$0.221 zone is key support; a breakout may double the price in the coming weeks.
Stellar (XLM) price has rebounded to $0.2358, showing resilience against the broader bearish sentiment in the crypto market. This recovery aligns with optimistic Stellar price prediction trends.
Despite a 12.38% weekly dip, momentum has started to recover. Bullish chart patterns and improved altcoin sentiment are driving this rebound.
Analysts have highlighted a falling wedge setup with bullish divergence. This aligned with strong buying pressure near the $0.209–$0.221 support zone. It positioned XLM price for a potential move toward $0.50.
Stellar Price Prediction: MACD Bullish Divergence Strengthens Case for Reversal
Technical analyst Andrew Griffiths shared a chart highlighting a falling wedge on XLM, a typical bullish reversal structure. In his Stellar price prediction, He pointed out a regular bullish divergence within the wedge on the MACD.
This divergence indicated that momentum is shifting in favor of buyers despite lower price action. The MACD histogram had curved upward, signaling potential bullish momentum. Additionally, the convergence of the signal lines indicated that bulls were regaining control.
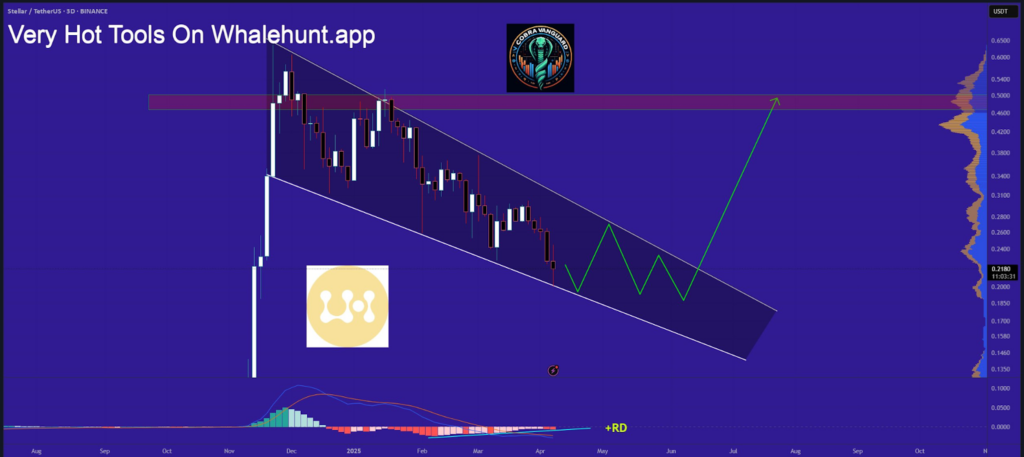
The falling wedge pattern has acted as a compression zone for price action. With XLM price repeatedly testing support and resistance lines within the wedge, each lower high appears to lose downward strength.
Griffiths noted that the breakout is yet to be confirmed. However, the structure favors a medium-term rally. Per Stellar price prediction trends, the divergence may continue, and the breakout may occur. If this happens, XLM price could extend toward the $0.50 resistance mark.
Price action above $0.24 would confirm a breakout from the wedge. Griffiths emphasized that if the breakout accelerates with volume, buyers may attempt a retest of $0.30 before targeting $0.50. The falling wedge and momentum indicators strengthen the bullish reversal outlook.
Support Zone Between $0.209 and $0.221 Remains Critical
Furthermore, Man of Bitcoin provided insights into XLM’s positioning within a key support area between $0.209 and $0.221. This zone served as a solid foundation during several corrections in the past.
It consistently attracted buyers whenever the price approached it. The consistent reaction from this area shows that demand is not weakening, even amid short-term volatility.
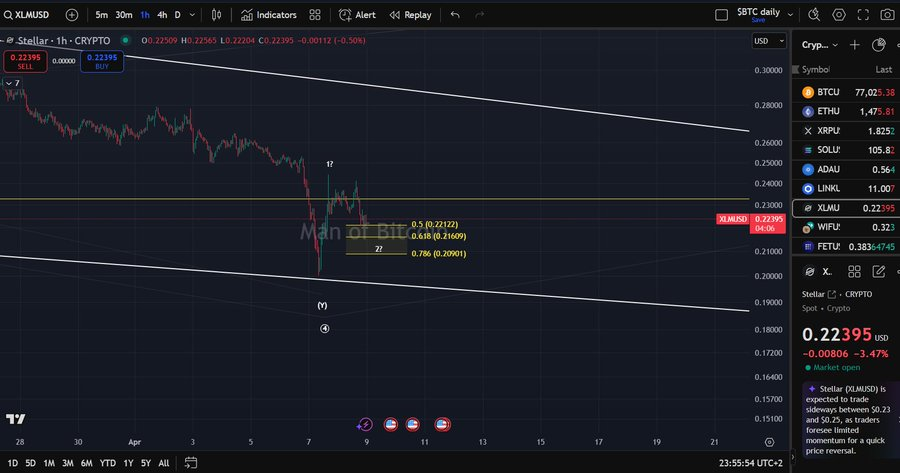
The recent bounce off $0.221 coincided with a pickup in trading volume. The support’s strength was validated by higher lows forming over the past 72 hours.
With bullish divergence aligning at this base, technical sentiment favors upward continuation. The zone serves as the base for the current reversal structure.
A breach below $0.209 would invalidate the bullish setup. However, as long as the XLM price consolidates above $0.221 and shows higher lows, the upward momentum remains intact. The $0.221 was the invalidation point for bullish scenarios.
Market Sentiment Aligns with Technical Structure
XLM’s recent 7% daily gain contrasts with its monthly decline, highlighting the volatile but shifting sentiment in the crypto space. The broader market’s stabilization, with Bitcoin holding near $83,000 and Ethereum hovering above $1,600, has encouraged altcoin rebounds.
Stellar price prediction trend aligned with this sentiment shift, and traders eyed setups for medium-term reversals. The RSI on the daily chart has been recovering, rising from the oversold zone towards the middle line.
This transition was an early indication of rising bullish pressure. If some key resistances are broken during the recovery phase, an extension could be expected to come into play. Volume indicators also provide signs of accumulation, thus implying that the sellers’ domain is gradually diminishing.
Key Resistance and Fibonacci Levels
With the price recovering from the $0.221 base, eyes are now on the $0.24–$0.25 zone for breakout confirmation. If XLM price closes above this range with rising volume, it could signal further bullish momentum.
The next psychological and technical resistance level was $0.30. Additional resistance levels were above $0.30 as the primary Fibonacci levels support the price of $0.50. This level was amplified up to nearly 100% of the support level.