

Key Insights:
- The daily chart reveals that if the SUI price holds the $3.20 level, it could initially soar by 15%.
- The red flag that can limit the SUI upside rally is the recent 44 million tokens unlocked.
Amid ongoing market uncertainty, Sui Network’s native token, SUI, is showing signs of strength. Despite a recent dip, the daily chart reveals that the asset has successfully retested the 200-day Exponential Moving Average (EMA) and the $3.20 level.
Trading above $3.20 now suggests that a massive upside rally could be on the horizon.
Expert’s Bullish View of SUI
SUI’s recent price action has been garnering attention from crypto enthusiasts, investors, and whales alike. On X (formerly Twitter), some suggest that SUI is poised for a massive rally and could reach $6, while others highlight it as a good spot to go long again.
A crypto expert shared on X that after a 22.5% correction, the SUI price has retraced to the box support level. This support, formed near the 200-day EMA, was highlighted by the expert, who noted, “Textbook descending broadening wedge consolidation above 200MA support. RM below, good spot to LONG again.”
Meanwhile, another crypto expert shared a post on X, predicting that the SUI price will reach $6 in June. However, this is a bold prediction that seems unlikely given the current market structure.
Not only that, but SUI’s daily trading volume on decentralized exchanges (DEXs) set a new record of $304.3 million in Q1. This significant increase suggests rapid network adoption, marking a 14.6% rise from the previous quarter.
At press time, the SUI price was trading near $3.32 and had remained stable over the past 24 hours. Despite the sideways movement, traders and investors have shown strong interest. Data from CoinMarketCap shows that during the same period, SUI recorded a 17% surge in trading volume compared to previous days.
This surge in trading volume amid a sideways market shows a bullish outlook and further hints that strong momentum is on the horizon.
SUI Technical Analysis and Price Action
According to expert technical analysis, the SUI price has formed a bullish structure and is poised for an upside rally.
The daily chart shows that despite a massive sell-off during the recent dip, the asset held the key support level at $3.20. Additionally, it retested the 200-day EMA, which further highlights its uptrend.
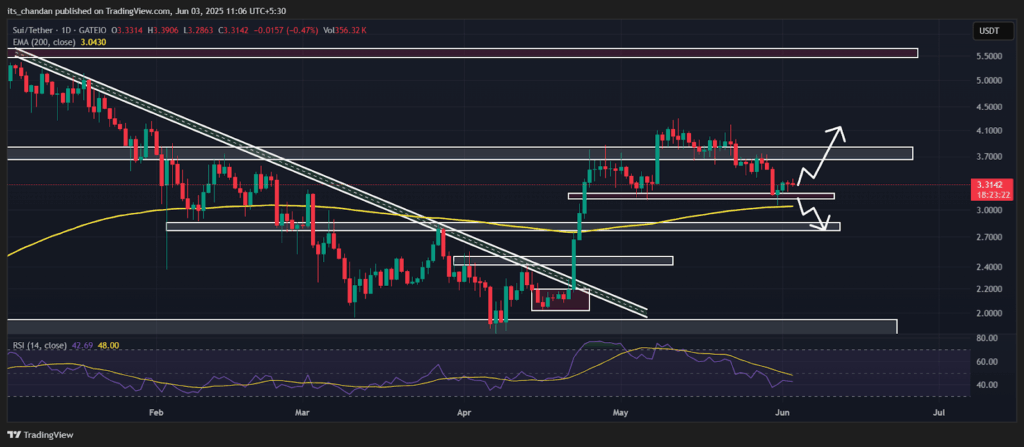
Based on recent price action, if the SUI price maintains above the $3.20 level, it could initially soar by 15%, reaching the $3.85 level.
Moreover, the last time SUI reached this level, it registered an upside rally of 34%. Investors and experts are now watching closely to see if history will repeat itself or if current uncertainty will limit the upside rally.
As of writing, SUI’s Relative Strength Index (RSI) stands at 43, indicating that the asset is nearing oversold territory. Whenever an asset’s RSI reaches this level, it often signals a potential reversal on the horizon.
Beyond this, it needs to be supported by the market structure and the views of experts and investors, which currently seem to be in favor of SUI.
Red Flag for SUI Coin
Based on this technical analysis, SUI’s current market outlook appears bullish, but there is one red flag that could limit its rally. On June 2, 2025, 44 million SUI tokens were unlocked, equivalent to 1.32% of the circulating supply.
However, SUI holders should also be aware that currently only 33.87% of the tokens are in circulation. This means the network still has to unlock 66.13%, which is a significant amount.
Additionally, the network has allocated approximately $140 million worth of tokens to be unlocked every month. This increased circulation could put serious selling pressure on the SUI price.