

Key Insights:
- The TRUMP coin price could see an upside rally of either over 20% or even 41% in the future
- The TRUMP Long/Short ratio stands at 1.20, indicating strong bullish sentiment among traders.
The Trump coin has been in a consistent downtrend for nearly a month, and based on the current price action, this bearish momentum could continue in the coming days. The daily chart shows that the meme coin has lost nearly 40% of its value in less than three weeks and is now testing a key support level at $9.55.
Current Price Momentum
As of writing, the TRUMP coin was trading near $10.17, and over the past 24 hours, it recorded a modest price surge of 1.65%. Despite the price increase, the meme coin has been experiencing a decline in trader and investor participation, as its trading volume dropped by 15% compared to the previous day.
This decline in volume occurred as the price showed signs of a potential reversal, indicating weak momentum for the TRUMP coin.
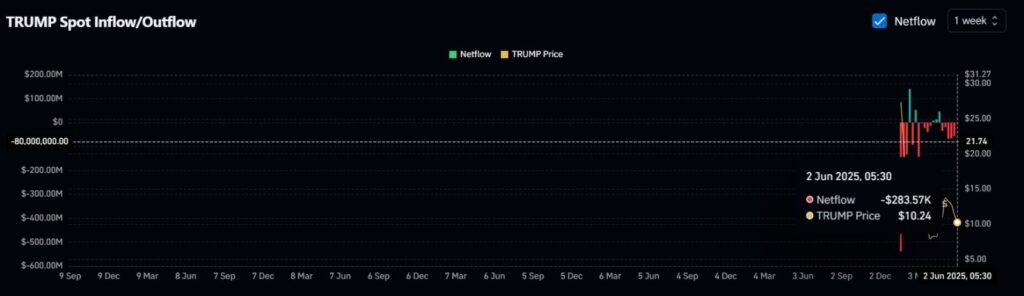
On-Chain Data Signals Fear and Hesitation
Given the current market sentiment and TRUMP’s price action, it appears that investors and long-term holders are hesitant to either accumulate or sell off, as reflected in the data observed on the on-chain analytics tool CoinGlass.
Data from spot inflow/outflow reveals that exchanges across the crypto market have recorded an outflow of $283K worth of TRUMP coins over the past week. This minor outflow from exchanges hints at potential accumulation by investors and long-term holders.
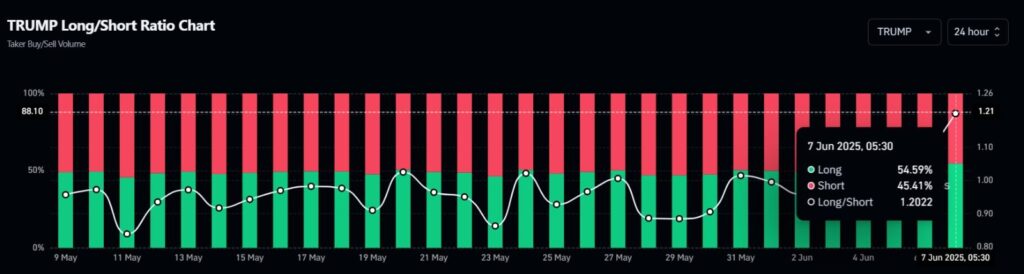
Traders Strongly Believe in the Long Positions
Meanwhile, traders have shown bullish sentiment, as long positions have reached their highest level since May 2025. At press time, the TRUMP Long/Short ratio stands at 1.20, indicating strong bullish sentiment among traders.
Additionally, the metric reveals that 54.59% of top traders are holding long positions, while 45.41% are holding short positions.
When combining these on-chain metrics, it appears that the bulls are present, but due to the weak market structure, they have been struggling to commit to either side.
Trump Price Action and Technical Analysis
According to expert technical analysis, the TRUMP coin price has been in a downtrend since May 2025. The daily chart reveals that during this period, the meme coin has consistently faced resistance from a descending trendline.
As shown in the four-hour chart, whenever the TRUMP coin price approaches this level, it encounters selling pressure that leads to downside momentum, a pattern that was also observed on June 6, 2025.
So far, the price of the meme coin is sitting at a key support level and is also near trendline resistance.
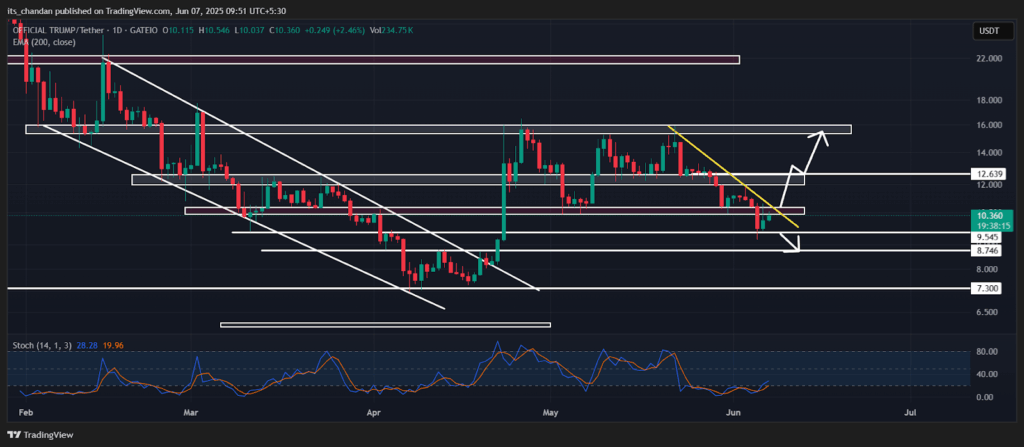
TRUMP Coin Price Prediction: Bullish or Bearish?
Based on recent price action and historical patterns, investors and traders could witness a decisive move in either direction.
If market sentiment remains unchanged, there is a strong possibility that the TRUMP coin price could experience a downside move of over 10%, potentially dropping to the $8.50 level.
On the other hand, if sentiment shifts and upward momentum accelerates, breaching the descending trendline, there is a strong possibility that the TRUMP coin price could see an upside rally of either over 20% or even 41% in the future, potentially reaching the $12.65 or $15 levels.
At press time, TRUMP’s Stochastic stands at 31 and 20, which clearly indicates the meme coin is trading in the oversold zone, hinting that a short-term bounce could be on the cards if buyers step in or if sentiment shifts.