

Key Insights:
- Dogecoin price rebounded from a broadening wedge support, signaling a potential move toward the $1 level.
- The stochastic indicator shows DOGE rising from oversold levels, historically followed by strong price rallies.
- Dogecoin has broken out from a falling wedge, with similar patterns leading to steep rallies in 2023 and early 2024.
Dogecoin price is showing renewed strength after rebounding from a long-term support zone, supported by a broader bullish market structure. Technical indicators and past chart behaviors are forming a case for potential price expansion, possibly toward the $1 level.
Dogecoin Price Rebound from Broadening Wedge
Trader Tardigrade pointed out that Dogecoin price recently bounced from a lower trendline within a broadening wedge formation. This structure, which features diverging support and resistance lines, has historically served as a setup for volatility and eventual breakout moves.
The bounce occurred near $0.13, a level that previously attracted buying interest, further validating the zone as a potential launch point for further gains.
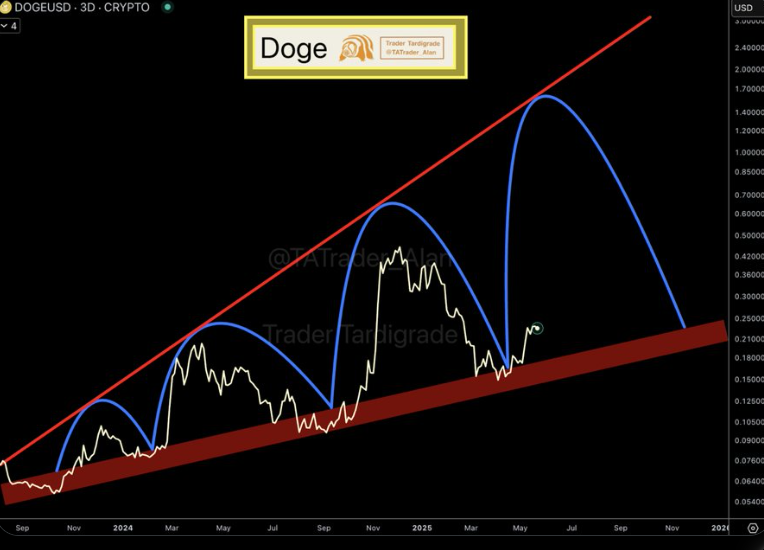
In addition, the meme coin price structure mirrors earlier movements in the asset’s historical chart. In previous cycles, Dogecoin rallied sharply after touching the lower boundary of similar formations.
Besides, the pattern suggested that the asset could now be entering a new phase of upside momentum.
If the current cycle maintains symmetry with past instances, the projected path could lead Dogecoin toward the $1 mark over the coming months.
DOGE Stochastic Indicator Signals Upward Momentum
More so, the stochastic oscillator on the two-week chart for Dogecoin price recently reversed upward from oversold conditions.
Historically, such movements have preceded periods of strong bullish performance. In previous market cycles, the stochastic’s move from low zones was often followed by price expansions of 200% or more.
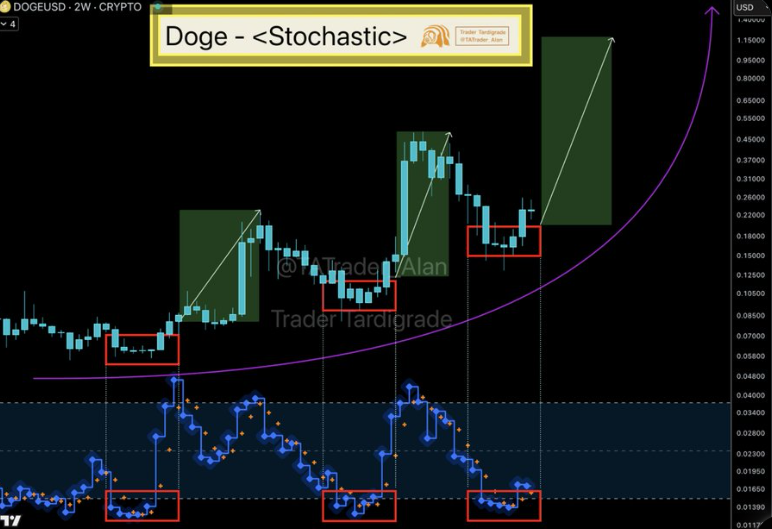
Consequently, the current setup reflects those prior conditions, with the oscillator rising from the lower end of its range. This development is viewed by many analysts as a measure of increasing buying pressure.
The timing of this upward shift also aligns with Dogecoin’s rebound from structural support, strengthening the possibility of a sustained move higher in the near term.
Breakout from Falling Wedge Confirms Pattern Continuation
Moreover, Dogecoin price has also broke out of a falling wedge pattern on the daily chart, a formation that typically precedes upward movement.
This technical setup has played out repeatedly over the past year. In each case, the asset followed the breakout with a steep rise in price. The recent breakout appears consistent with this historical behavior.
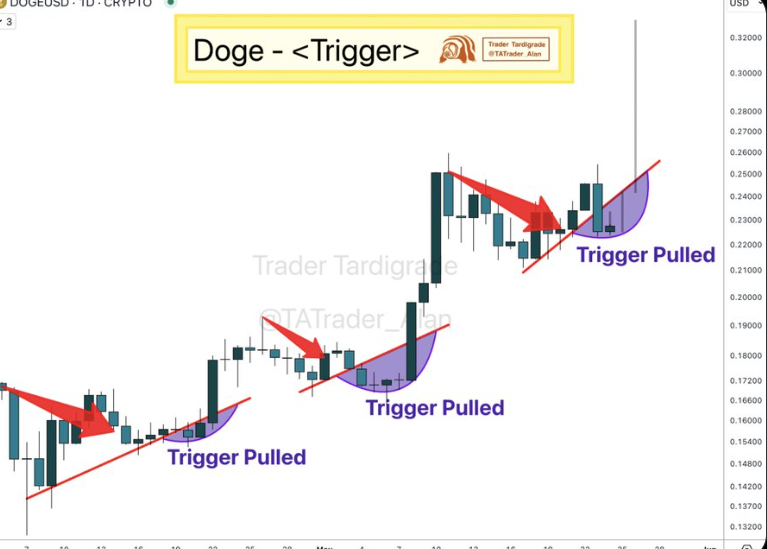
Notably, previous falling wedge breakouts in late 2023 and early 2024 led to sharp rallies that doubled or tripled Dogecoin’s value in a short span. The current pattern is similar in structure and timing.
The breakout occurred after a well-defined downtrend and at a point where market momentum appeared to be building. This provided an additional layer of support for the outlook of upward price extension.
Altseason Context Strengthens DOGE Bullish Scenario
Meanwhile, broader market indicators suggest the return of an altseason, a period in which altcoins outperform Bitcoin in terms of percentage gains.
The Total2 market capitalization chart, which tracks the valuation of all cryptocurrencies excluding Bitcoin, has broken above a multi-year resistance level. Similar breakouts in 2016 and 2020 preceded strong altcoin rallies.
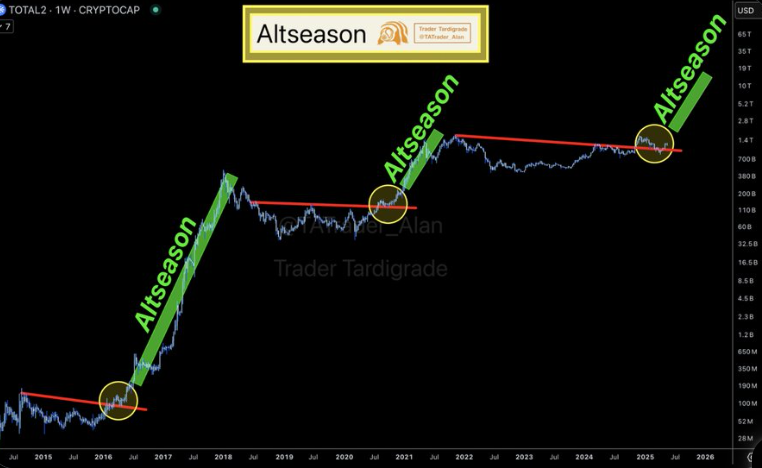
Dogecoin price technical setup now exists within this broader market environment. Its recovery from support, improving momentum indicators, and breakout from key patterns coincide with early signs of altseason. Historically, Dogecoin has performed strongly during altseason periods, making the current alignment of technical and market-wide signals noteworthy.
At the time of writing, Dogecoin price was trading at $0.22, down 2% intraday. The meme coin price faced resistance at $0.235 and support holding near the $0.222 level amid low trading volume.