

Highlights:
- Dogecoin faces a strong resistance zone between $0.245 and $0.265, repeatedly rejecting upward price moves since January.
- DOGE is testing an ascending trendline support on the 4-hour chart, indicating a potential bounce from the current level.
- A successful rebound from trendline support could push Dogecoin toward the $0.245–$0.25 resistance region again.
Dogecoin (DOGE) price is approaching a decisive technical zone as traders watch for a bounce from support. This development could influence whether the meme-based cryptocurrency challenges its multi-month resistance level near $0.26.
Notably, DOGE has encountered repeated rejections between $0.245 and $0.265 since January, forming a clear resistance wall. The area has acted as a ceiling on multiple occasions, where buying momentum weakened and the asset lost ground.
Dogecoin Price Resistance Between $0.245 and $0.265 Remains Key Barrier
Based on daily chart readings, Dogecoin has consistently failed to push above the $0.265 level. This range has been a rejection zone since early 2025, with every upward attempt leading to swift pullbacks.
In addition, the area aligns with previous breakdown points and has seen high trading activity. Consequently, it is suggested that many holders may be offloading positions when the price reaches that zone.
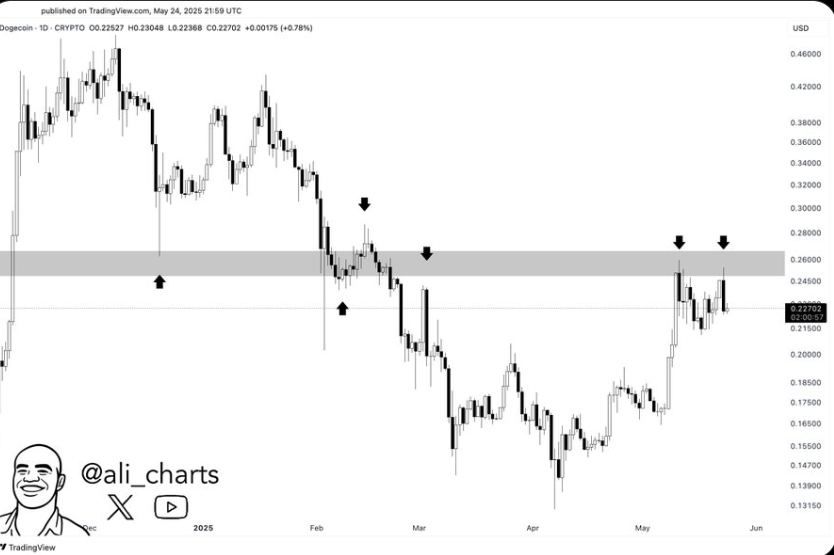
Meanwhile, technical analyst Ali shared a daily chart showing that this horizontal resistance is the most important price wall DOGE needs to break. Arrows across several points indicate how the $0.245–$0.265 band has remained influential in restricting upward movement. This reinforces its role as a zone where selling pressure outweighs demand, stalling price progress.
DOGE Tests Support Trendline on the 4-Hour Chart
At the time of writing, Dogecoin is also approaching an ascending trendline on the 4-hour chart. The pattern, identified by analyst Trader Tardigrade, shows a series of higher lows, indicating that buyers have stepped in at gradually increasing prices. The current price action suggests DOGE is testing this support again, near the $0.225 level.
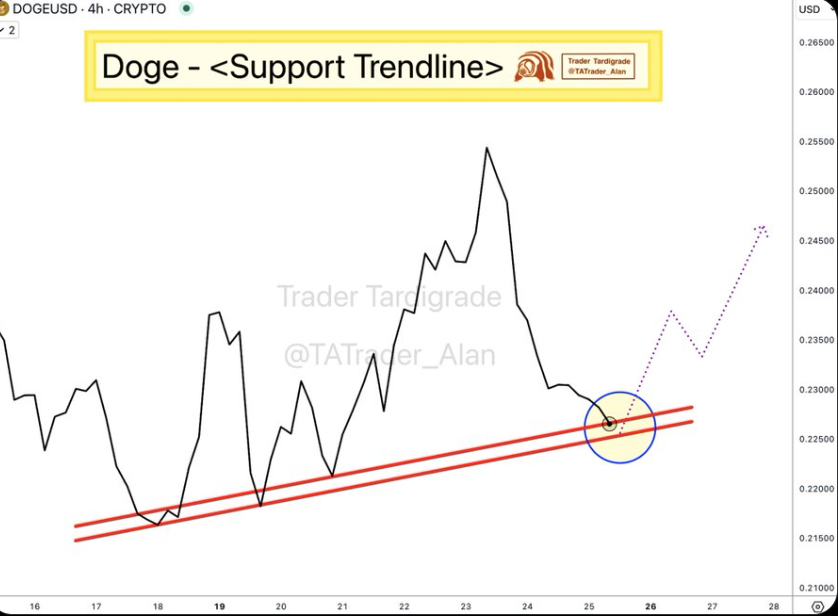
Besides, the trendline has provided a reliable base across recent sessions. It has held through several retracements, making it a short-term gauge of buying strength.
If Dogecoin maintains this structure and bounces from this level, it could reinforce the ongoing upward channel. Furthermore, it may potentially set up another move toward the upper resistance band.
A Bounce Could Return Dogecoin Price to Familiar Levels
More so, if the ascending trendline holds, Dogecoin price could revisit the $0.245–$0.25 range. Previous rallies from this support line have reached those levels before losing momentum. A similar pattern appears to be forming now, with price action aligning near the confluence of the rising trend and historical reaction zones.
Moreover, the chart shared by Tardigrade included a projection suggesting a short-term recovery toward the $0.245 region if a rebound materializes. A failure to hold the trendline, however, may shift focus to lower support areas around $0.215. The decision point now centers on whether bulls can defend the ascending base strongly enough to fuel another upward test.
Further analysis by Trader Tardigrade revealed a hidden bullish divergence between Dogecoin price and its RSI on the daily chart. While DOGE formed a higher low, the RSI printed a lower low, suggesting underlying strength.
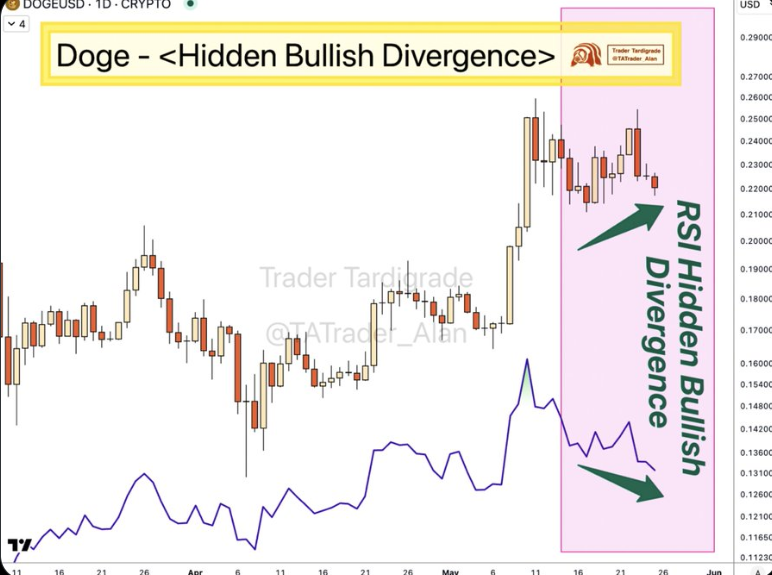
This divergence may indicate potential upward continuation if buying volume supports the structure and price maintains its current higher low formation.
Market Watches for Breakout or Rejection
Meanwhile, the combination of horizontal resistance and diagonal support has created a technical squeeze for Dogecoin. The setup presented a narrow range in which price movement is compressing, a pattern often followed by volatile shifts.
Volume trends and confirmation from broader market movements may determine whether DOGE can sustain a push beyond $0.26. Without increased momentum or a spike in demand, the repeated rejections at this level may continue. Until then, DOGE remains confined within a defined range, where support and resistance shape near-term price action.