

Key Insights:
- $143 breakdown could liquidate $44.95M in long positions, raising volatility risk.
- SOL forms a triangle pattern with MACD weakness and key support at $140–$143.
- A breakout above $147 may send Solana to $180 and challenge the $200 resistance.
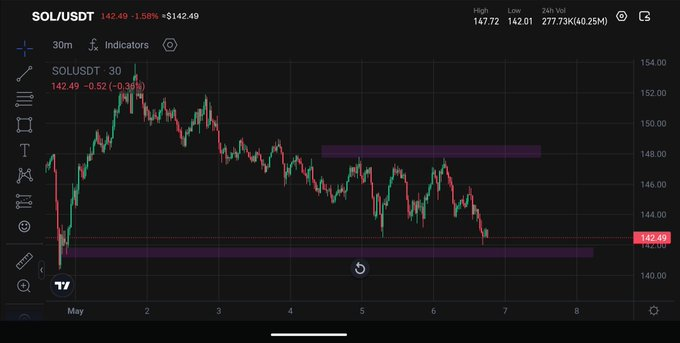
Solana price is trading near $144.48 following a 1.9% daily gain on May 5, which has now reversed into a 1.5% intraday drop. The price continues to tighten within a symmetrical triangle pattern, signaling reduced volatility and the likelihood of a decisive move.
The $143 support level has emerged as a critical threshold, with $44.95 million in long liquidations at risk. Meanwhile, resistance around $147 is acting as a pivotal breakout level that could open the way toward $180 or even $200.
Analyst Predicts Solana Price Could Reach $200, Here’s How
Joe Swanson stated that Solana price has broken through a descending trendline and is now testing resistance near $147. He pointed out that maintaining the $140 support base may provide enough strength to drive the price toward $155.
If a breakout above $147 occurs with volume confirmation, Swanson anticipates price expansion to $180. Swanson’s analysis showed a clean technical structure where $147 forms the ceiling of a boxed consolidation range.
Another chart shared by technical analyst EliZ presented a boxed trading range between $132 and $147. The upper edge of this structure aligned with the triangle’s upper boundary and a historical supply zone from March.
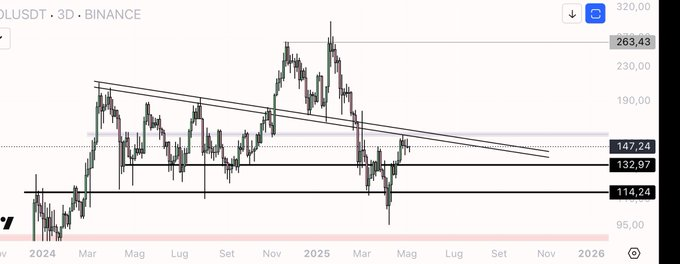
A successful breakout and retest above $147 would suggest bullish continuation and unlock a push toward $180 and $200, both of which were key resistance zones during earlier rallies in 2025.
$143 Breakdown Could Trigger Long Liquidations for Solana
According to CoinGlass data, a price drop below $143 would threaten nearly $44.95 million in long liquidations. This support level aligns with the bottom edge of the symmetrical triangle pattern visible on the 4-hour chart.
A breakdown here may cause a domino effect, leading to rapid price declines across major trading platforms.
The 200-period simple moving average currently lies close to the $140 level, further reinforcing this region as a final support.
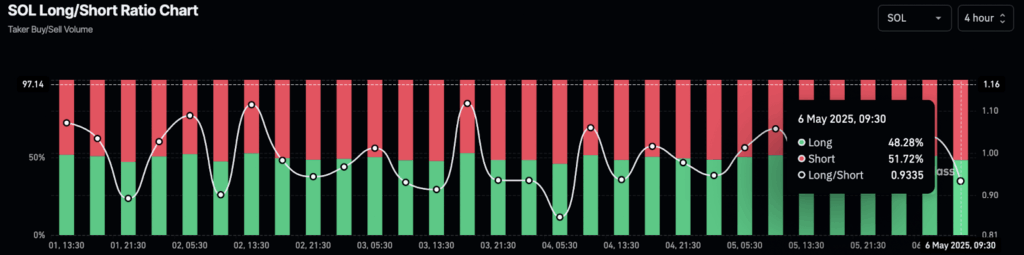
Short positions now dominate the derivatives market, representing 51.72% of total open interest. The long-to-short ratio has slipped to 0.9335, indicating a slightly bearish market posture and increased pressure on long traders to maintain their positions above this zone.
Solana Price Forms Triangle Pattern
Solana price continues to coil within a symmetrical triangle, formed by converging trendlines. This structure reflects a standoff between bulls and bears, with price now consolidating near $145. Breaching the 50- and 100-period simple moving averages during recent declines has increased the risk of a negative crossover, typically seen as a bearish signal.
MACD and signal lines hover in negative territory, and they’re gradually converging, which means momentum is waning and short term direction is unreliable.
Below $140, the next level of interest comes in around $134, a zone that is also correlated with the 200 period average, and could act as an intermediate support on the downside.
$120 Remains Key Support in Solana Price Prediction
However, Ali Charts maintained that $120 is the most reliable long-term support in Solana price structure. The level has acted as a turning point during several phases since 2022, serving both as resistance during uptrends and as support during corrections.
Historical data reflects rather sharp response indications around this level, proving its structural significance.
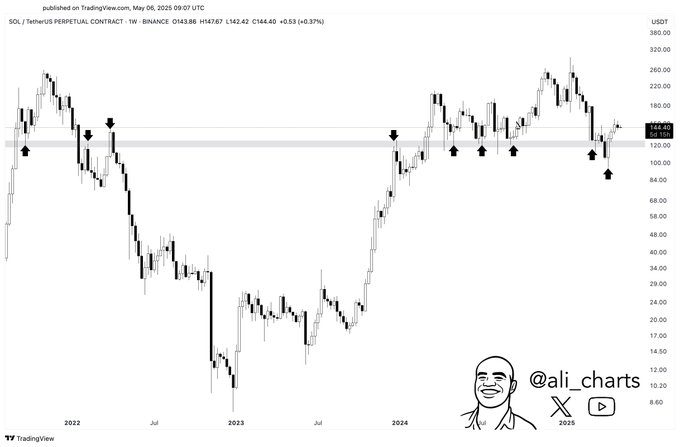
If Solana price declines further, it may gradually return to trading in the $120 support level range. This level has not been violated on a regular basis in the past even during other market downturns.
Regarding long-term trends in Solana prices, analysts have identified $120 as a bottom support level that determines a trend’s trajectory and investor sentiment during volatile periods.