

Highlights:
- After a 60% correction and consolidation, XDC is on historic bullish cycles with resistance at $0.51 and $0.82.
- A developing Stochastic RSI approaching the 80 bracket, indicating increasing buying ease.
- As the 21-day moving average is still above the 33-day one, bullish movement continues until the price reaches the critical $0.078.
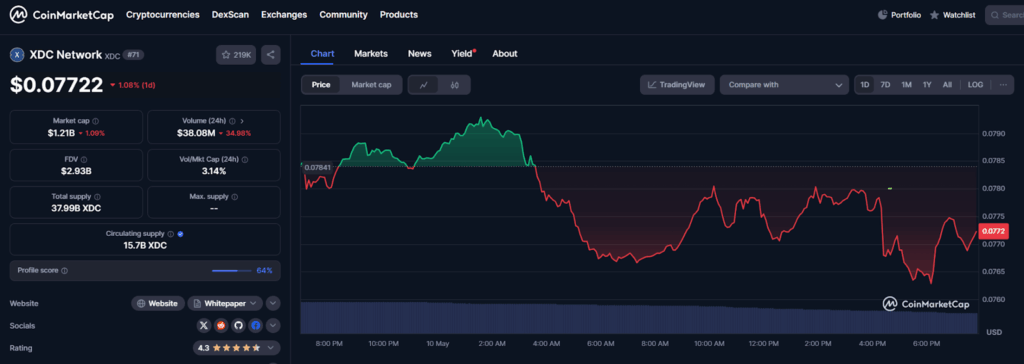
XDC Network is showing historical patterns. As of press time, the asset’s value was $0.07722. In the past 24 hours, XDC Network’s price has dropped by 1.08%, and the trading volume has stood at about $38.08 million from CoinMarketCap. Although a short-term drop exists, the asset’s fundamental structures remain, with a circulating supply of 15.7 billion tokens.
Analyst’s graphical analysis demonstrates a standardized pattern between the present XDC trend and its macro cycle. From the visual breakdown, a 60% drop was followed by consolidation, a phase that preceded a considerable ascent in history.
The movement is tracked using a color-coded marker indicating the red color for correction, green for the accumulation base, and blue for peak formation.

During the previous bullish period, XDC had increased its price by over 1030% from the beginning to peak at $0.135. According to the experts, this led to the final high of $0.194. Fibonacci levels present at 1.414 and 1.618. These are levels anticipated at approximately 0.51 and $0.82, respectively.
These levels are the primary intermediate targets for price before the first chance to retrace to the old all-time highs. The pattern on the modern chart reflects the past accumulation periods. This means that price movements reflect the trend.
Stochastic RSI Reinforces Early Momentum Structure on the XDC Price
The weekly Stochastic Relative Strength Index (Stoch RSI) also shows that the first momentum signals are a reality. The oscillator stands right below the middle. This is yet that it is undoubtedly on its way north to the 80 boundary, a historical level tied to expansive price movement.
The conditions suggest the possibility of early growth in the upward price movement. Experience indicates that there are always strong directional price movements whenever the RSI cuts through and trades above 80.
Despite the absence of confirmed arrival, the price trend can be seen leading toward strengthening in the present direction.

The further evolution past this level would likely be a turning point, reflecting more technical support for the asset and increased market confidence.
Moving Averages in Focus as Bullish Integrity Faces a Test
Another major technical factor in the monitoring process involves the relationship between the 21-week Exponential Moving Average (EMA) and the 33-week Simple Moving Average (SMA). In past cases, crossing the 21 E MA below the 33 MA was a predictor for extended correction periods.
Thus far, XDC has been putting itself in a perilous position to cross, but has managed and remained above with the moving averages converging. Conserving the EMA atop the MA would guarantee conserving the bullish configuration. From the past, cases where such a cross is avoided have often foretold massive price rises.

Alternatively, if a crossover happens, it might invalidate the current arrangement and trigger a medium-term outlook reassessment. Since the price is close to $0.078, future months may indicate whether or not the bullish view is still adequate.
Market Structure and On-Chain Metrics Remain Neutral
At the present volume-to-market cap ratio of 3.14 %, the trading activity is deemed moderate, indicating moderate volatility.
Over the past 24 hours, prices have been restricted within a narrow space of a $0.076 – $0.079 price margin. Under even small price swings, the realities of the overall market and macroeconomic conditions are compelling analysts and traders to remain cautious.
The resistance levels at $0.097 and $0.135 also correspond to the equilibrium of the Fibonacci retracement points achieved at prior cycles.
If these support and resistance levels are broken, it will validate structural growth. On the opposite side of the scale, breaking below the $0.070 support can change the prevailing mood and wear down the existing market climate.